0%
Tennessee's tax on wages, and on interest and dividends since 2021
How Franklin works · Living here
Franklin's residents rate it among the best places to live in the country, and on crime, schools, health and jobs the state's own figures agree. What they rate worst is the price of a house and the traffic. Every measure we could find, from the city's survey to the state's crime report, set beside Tennessee's, and the households the costs fall on.
What the numbers favorCompared with
What they costCompared with
Yes, by nearly every measure that can be counted, and at a price. In the city's own survey, 93 percent of residents rated their quality of life excellent or good, 12th of the 391 communities that asked. The state's figures agree. Franklin's police recorded serious crime at under half the state's rate in 2025. The county district's students meet the state's standards in English and math at about 1.7 times the state's rate. Life expectancy in Williamson County is eight years longer than in Tennessee as a whole, and the city has 2.3 jobs for every job its residents hold.
The price is getting in. Zillow's typical Franklin home was worth $913,277 in September 2026, 2.8 times the typical home in Tennessee, and in the census survey the median home cost 5.9 years of the median household's income, against 4.1 statewide. One resident in five rates the supply of affordable housing good. The other complaint is the roads: 79,286 of the city's 91,459 jobs are held by people who live somewhere else, and 41 percent of residents rate the traffic on major streets good, though the average Franklin commute is shorter than the county's.
The averages describe the people who already live here. The costs land hardest on the ones arriving: a first-time buyer, a renter starting on one salary, anyone planning to retire. Section 09 does that arithmetic. The rest of the page sets each measure beside the state's, with the source, so you can weigh them for yourself.
Every three years since 2016 the city has paid the National Research Center at Polco to mail a questionnaire to 3,000 randomly chosen Franklin households and weight the answers to match the city's adults. The same questions go out in hundreds of American towns and cities, so every answer can be ranked against theirs. The 2025 survey, presented to the board on July 8, 2025, drew 406 replies. That is a response rate of 14 percent, and it puts the margin of error at plus or minus 5 points.
On the question this page asks, the answer was close to unanimous. Ninety-three percent rated the overall quality of life in Franklin excellent or good, 12th of the 391 communities that asked in the last five years, and 94 percent said the same of Franklin as a place to live. Ninety-seven percent said they felt safe. Franklin's ratings for its ambulance service ranked 3rd of 347 communities, the fire department 4th of 363 and the police 6th of 385, and 80 percent rated the value of city services for the taxes paid excellent or good, 5th of 380.
Then the survey asked about the price of it. Twenty percent rated the availability of affordable quality housing excellent or good, 262nd of 348, and 29 percent the cost of living, 221st of 323. Fifty-five percent called affordable housing poor, up from 35 percent in 2016. Asked for the most important problem facing the city once traffic was set aside, 38 percent named housing or the cost of living and 27 percent the management of growth. The question set traffic aside, and the survey's rating questions measure it instead: 41 percent rated the flow on major streets excellent or good, and the rating of the transportation system as a whole fell from 69 percent in 2022 to 49.
| 2025, excellent or good | Share | Rank |
|---|---|---|
| The overall quality of life in Franklin | 93% | 12th of 391 |
| Franklin as a place to live | 94% | 27th of 373 |
| Franklin as a place to raise children | 93% | 16th of 378 |
| Franklin as a place to retire | 73% | 44th of 372 |
| Overall feeling of safety | 97% | 17th of 357 |
| The value of services for the taxes paid | 80% | 5th of 380 |
| Overall quality of the transportation system | 49% | 169th of 311 |
| Traffic flow on major streets | 41% | 253rd of 353 |
| Cost of living | 29% | 221st of 323 |
| Availability of affordable quality housing | 20% | 262nd of 348 |
The National Community Survey, City of Franklin, 2025: the report of results and the benchmark report. A rank is Franklin's place among the communities in the firm's database that asked the same question in the last five years; first is the highest share. Shares leave out "don't know."
The trend runs the same way. Quality of life was rated excellent or good by 97 percent in 2016, 2019 and 2022, and by 93 percent in 2025, a drop smaller than the 6.7 points the survey needs before it calls a change real. The share rating Franklin a good place to retire fell from 84 percent to 73, one of only two answers that moved significantly down. Fewer people answer every time, too: 37 percent of households sent the survey back in 2016 and 14 percent in 2025, and those who did were older and more often owners than the city, which the weighting corrects for as far as it can.
The price of a Franklin house is the county's price, which is about two and a half times the country's. Zillow's index of a typical home's value stood at $913,277 in Franklin in September 2026, against $330,844 for Tennessee and $366,157 for the United States. It rose 3.0 percent in the year and 30.9 percent in five. Redfin, which counts closed sales, puts the median at $863,089 for the 437 homes sold from July to September. The two measure different things, a typical value and the middle sale, and both run well above the census survey's median of $705,400, which averages what owners said their homes were worth from 2020 to 2024.
Only the census figures can be set beside incomes from the same households and years. By them, the median Franklin home was worth 5.9 years of the median household's income. In Tennessee and in the country as a whole it was 4.1.
| September 2026 | Typical home value | Typical rent |
|---|---|---|
| Franklin | $913,277 | $2,038 |
| Williamson County | $916,175 | $2,122 |
| Nashville metro area | $448,896 | $1,803 |
| Tennessee | $330,844 | – |
| United States | $366,157 | $1,932 |
Zillow's Home Value Index (all homes, the middle third of values, smoothed and seasonally adjusted) and its Observed Rent Index (the middle of asking rents, houses and apartments), September 2026. Zillow publishes no rent index for states. Its city boundaries are its own and may not match the city limits exactly.
Renting is much closer to the national price than buying is. The rent index, the middle of what listings ask, was $2,038 a month in September, up 0.8 percent in a year, against $1,932 nationally, about 5 percent more. And measured against what its renters earn, renting in Franklin is no harder than in the rest of the state. In the census survey, 47.1 percent of Franklin's renter households paid 30 percent or more of their income on rent and utilities, against 48.8 percent in Tennessee and 51.1 percent in the country, a difference inside the margin of error. One renter household in five paid half its income or more. Owners with a mortgage come out the same way: 24.3 percent paid 30 percent or more of their income on housing, against 24.6 percent statewide.
The tax bill is where Franklin gives some of it back. Tennessee does not tax wages, and since 2021 it has not taxed interest or dividends either. The property tax is low. A Franklin home outside the Franklin Special School District pays $1.566 per $100 of assessed value for 2026, and a home is assessed at a quarter of its appraised value, so the bill comes to 0.39 percent of the appraisal a year: about $3,379 on a house appraised at the median sale price, or $4,840 inside the special school district. The sales tax runs the other way: most purchases carry 9.75 percent, the same as Nashville, and groceries 6.75 percent. The property tax explainer works a bill line by line.
The monthly bills are a smaller matter. A house on city water that uses 6,000 gallons a month pays $148.90 for water, sewer, stormwater and one trash cart, by our water bill explainer's count, and 1,000 kilowatt-hours from Middle Tennessee Electric came to $124.25 at its October 2026 rate. Across the Nashville area, the Bureau of Economic Analysis found prices 3.7 percent below the national average in 2024 and rents 4.6 percent above it; Tennessee as a whole ran 8.1 percent below on everything and 20.9 percent below on rents. Franklin is an expensive housing market in a state where most other things cost less.
Most of Franklin's children go to Williamson County Schools. Inside the Franklin Special School District, which follows the city limits as they stood in 1986, kindergarten to eighth grade belongs to the FSSD, and its students go on to a county high school. Our school zoning explainer says which schools an address is zoned for. This section is how the two districts score.
On the state's tests last spring, 70.5 percent of the county district's students in grades three to eight met or exceeded the state's expectations in English and 75.1 percent in math. Statewide the shares were 40.6 and 43.0 percent; in the FSSD they were 59.8 and 64.4. All three rose from the year before. The county's class of 2025 graduated on time at 97.4 percent, against 92.3 percent statewide. Its graduates averaged 25.3 on the ACT, against the state's 19.3, and 79 percent of them scored 21 or higher, the highest share of any district in Tennessee.
| Measure | Williamson County Schools | Franklin Special School District | Tennessee |
|---|---|---|---|
| English, grades 3–8, met or exceeded, 2025–26 | 70.5% | 59.8% | 40.6% |
| Math, grades 3–8, met or exceeded, 2025–26 | 75.1% | 64.4% | 43.0% |
| Graduated on time, class of 2025 | 97.4% | – | 92.3% |
| Average ACT, class of 2025 | 25.3 | – | 19.3 |
| Chronically absent, 2024–25 | 7.4% | 5.1% | 18.3% |
| Schools graded A, 2024–25 | 33 of 52 | 4 of 8 | 355 of 1,697 |
| Spent per student, 2024–25 | $13,422 | $22,455 | $13,862 |
| Economically disadvantaged students, 2024–25 | 3% | 10% | 29% |
Tennessee Department of Education: the 2025–26 district and state assessment files, the 2024–25 graduation, ACT, chronic absenteeism and letter grade files, the 2024–25 report card file (spending includes federal, state and local money) and the 2024–25 district profiles. The FSSD ends at eighth grade. Chronically absent is missing a tenth or more of the school days a student was enrolled.
In December 2025 the state published its letter grades for 2024–25. The county district had 33 A's among its 52 schools and nothing below a C; the FSSD had four A's and four B's. Achievement is half the grade, and every school in both districts earned an A on it. The schools that came in lower lost their points on growth, the state's measure of how much students gained in a year against what its model expected of them. On that measure the county district is more ordinary: 31 of its schools got an A for growth, and 12 got a D or an F.
Two numbers the rankings leave out. The county district spent $13,422 a student in 2024–25, a little less than the state's average of $13,862. The FSSD spent $22,455, most of it raised by its own property tax. And the students are not the state's students: by the state's count 3 percent of the county district's students were economically disadvantaged, against 29 percent statewide and 10 percent in the FSSD. The scores cannot say how much of that gap comes from the schools and how much from the families; the growth grades above are the state's attempt at the first.
The county district is also shrinking. It enrolled 42,336 students in 2022–23 and 40,648 this fall, 4 percent fewer, and its kindergarten class fell 14 percent over the same years, from 2,630 to 2,252. Families who want something else have 16 private schools enrolling students inside the city limits, by the state's directory.
Franklin's police recorded 2,515 serious offenses in 2025, by the Tennessee Bureau of Investigation's count, or 27.8 for every 1,000 residents. Statewide the rate was 58.5. The count is what the state calls Group A offenses, two dozen kinds of crime from murder to fraud to drug possession, with every offense in an incident counted. Two were murders. There were 124 aggravated assaults, 33 burglaries and 42 stolen vehicles, and 272 of the 558 thefts, almost half, were shoplifting.
| 2025 | Serious offenses | Population | Per 1,000 |
|---|---|---|---|
| Franklin | 2,515 | 90,436 | 27.8 |
| Brentwood | 1,059 | 45,545 | 23.3 |
| Spring Hill | 1,203 | 61,615 | 19.5 |
| Murfreesboro | 11,779 | 172,248 | 68.4 |
| Metro Nashville | 70,785 | 718,499 | 98.5 |
| Tennessee | 429,120 | 7,337,623 | 58.5 |
Tennessee Bureau of Investigation, Crime in Tennessee 2025 (August 31, 2026): Group A offenses reported by each city's police department, and the population TBI used, which is the FBI's for the department and runs a little above the Census Bureau's estimate. TBI prints its rates per 100,000.
TBI asks readers not to rank departments by these figures. Ranking on the numbers alone, its report says, "would neither be fair to the agencies nor their communities," because so much of what drives crime is outside a department's control. The totals also include drug, weapon and fraud offenses, which depend partly on how hard a department looks for them. Read the table as a sense of scale: Franklin sits near its suburban neighbors and well below Murfreesboro, Nashville and the state as a whole.
The direction is good. Franklin's rate in 2025 was the lowest of the last five years: 28.7 in 2021, 34.4 in 2022, 31.7 in 2023, 32.2 in 2024 and 27.8. Not every line fell. Aggravated assaults rose from 102 in 2024 to 124, and reported rapes from 12 to 22. In the city's survey, 97 percent of residents said they felt safe.
The roads are the likelier danger. Twenty-three people died in traffic crashes inside the city limits in the six years from 2019 to 2024, by the federal count; Franklin's police recorded five murders in the five years from 2021 to 2025.
By our reading of County Health Rankings' 2025 data, Williamson County is also the healthiest county in Tennessee on both of the program's summary measures, and the only one in the healthiest of the ten groups the program now sorts the country's counties into. Life expectancy is 82.0 years, against 73.8 in the state and 77.6 in the country. Among residents under 65, 5.7 percent have no health insurance, against 11.0 percent statewide. There is a primary care doctor for every 713 people, against one for every 1,440 in Tennessee, and the overdose death rate is under a third of the state's, 16.1 per 100,000 against 53.2.
The hospital is Williamson Medical Center on Carothers Parkway, the county's own, which also runs the ambulance service for the whole county; its ambulances reached calls across the county in 7 minutes 55 seconds on average in 2023. It is not a designated trauma center. The nearest Level I center is Vanderbilt's, about 21 miles by road from City Hall. The county is weighing the hospital's sale, which our County Commission explainer follows. Franklin's fire department has held the top rating, Class 1, from the insurance rating office ISO since December 2015, by the city's account.
Franklin is not a bedroom suburb. In 2023, the newest year of the Census Bureau's records of where people work, 91,459 jobs were based in the city, half again as many as in 2013, while Franklin's own residents held 39,677 jobs. That is 2.3 jobs in town for every job a resident holds. Only 12,173 people both live and work in Franklin. The other 79,286 jobs in the city, 86.7 percent of them, go to people who commute in, and more people commute from Davidson County to Franklin, 18,048, than from Franklin to Davidson, 14,835.
| 2023, all jobs | Jobs |
|---|---|
| Jobs based in Franklin | 91,459 |
| held by people who live in Franklin | 12,173 |
| held by people who live elsewhere | 79,286 |
| Jobs held by Franklin residents | 39,677 |
| based in Franklin | 12,173 |
| based somewhere else | 27,504 |
U.S. Census Bureau, LEHD Origin-Destination Employment Statistics (LODES 8), 2023, all jobs: jobs covered by unemployment insurance plus federal civilian jobs, so a person with two jobs counts twice and the self-employed are left out. A job is placed where the employer reports it, which for a remote worker can be another city.
The work is mixed. The largest sectors by jobs in the city are retail (10,277), health care (9,763), education (9,501), restaurants and hotels (8,532) and finance and insurance (8,327). The biggest employers, in the city's 2025 financial report, are Community Health Systems with 6,438, Williamson Medical Center with 2,300, the Lee Company with 1,790, Nissan North America with 1,758 and Schneider Electric with 1,511. Community Health Systems, Acadia Healthcare, Nissan North America, Ramsey Solutions and CKE Restaurants keep their headquarters here. Few who want work are out of it: Franklin's unemployment rate averaged 2.8 percent in 2025, and in August 2026 it was 2.9 percent, against 3.7 percent for Tennessee and 4.3 percent for the country.
For all the complaints, the commute itself is short. Among Franklin workers who leave home for work, the average trip took 23.9 minutes in the census survey for 2020 to 2024, shorter than the county's 27.9 and the country's 26.4, and about the state's within the survey's margin of error. Only 12.3 percent took 45 minutes or more. Another 30.4 percent worked from home, more than twice the state's share, though those years include the pandemic.
The roads carry the region's commute as well as the city's. The Tennessee Department of Transportation estimated 132,602 vehicles a day on I-65 between Highway 96 and McEwen Drive in 2025, and INRIX, a traffic data company, estimated 65 hours of delay per driver in the Nashville area that year. Almost nobody rides transit: 0.1 percent of Franklin's workers. Franklin Transit runs two routes every 30 minutes, Monday to Saturday, for $1, and an on-demand van across most of the city; WeGo's Route 95 runs four trips each weekday morning to downtown Nashville and four back, for $4.25. Nashville International Airport is 22.5 miles from Main Street, about 32 minutes with the roads clear.
Franklin's weather, by NOAA's averages for 1991 to 2020 at the weather station at the city's sewage plant, is long hot summers and short winters. July afternoons average 90.8°F and January nights 28.6°F. Forty-five days a year reach 90 degrees, and 84 nights fall to freezing or below, against 66 at Nashville's airport. It rains 53.79 inches a year, a little more than Nashville's 50.51. The snow average is 1.7 inches, though NOAA marks it provisional for gaps in the record; Nashville's is 4.7.
Tornadoes are rare here, and most come at night. Since 1960 the National Weather Service has confirmed 26 in Williamson County, and 18 of them touched down between 6 p.m. and 6 a.m. Our severe weather guide has every one, and what to do about the hour.
The Harpeth River runs through the middle of the city. Its gauge at Franklin is in flood at 30 feet, and the river has reached that in 6 of the 51 years since 1975, most recently in March 2021. The record is 35.32 feet, at 4:15 a.m. on May 2, 2010, when the river stayed above flood stage for 50 hours. At 30 feet, the Weather Service says, water reaches parts of Hillsboro Road between Highway 96 and Fieldstone Parkway, properties north of Bridge Street downtown, and homes on Rebel Circle, Crafton Avenue and Allen Avenue. Before buying near the river, look the address up on FEMA's flood map.
The air is mostly clean. Williamson County's one air monitor, which measures ozone through the warmer months, logged 216 good days and 27 moderate ones in 2025 and none unhealthy. Across the Nashville metro, where monitors also measure fine particles, 187 days were good, 177 moderate and 1 unhealthy for sensitive groups. Pollen is middling: the Asthma and Allergy Foundation of America ranked the Nashville area 61st of 100 metro areas in 2026, where first is worst, after 29th in 2025.
Franklin is richer, more schooled and more likely to have come from somewhere else than Tennessee as a whole. In the census survey for 2020 to 2024, its median household income was $119,528, 1.7 times the state's $69,595; 64.5 percent of its adults held a bachelor's degree, twice the state's 31.1 percent; and 34.7 percent of its residents were born in Tennessee, against 57.2 percent of Tennesseans. Its share of Black residents is about a third of the state's, 5.3 percent against 15.4, and its share of Asian residents more than four times the state's, 8.2 percent against 1.9. Hispanic residents are 8.1 percent, close to the state's 7.4. The population explainer has the full profile beside the county, the state and the country.
The county votes Republican and Franklin a little less so. In the November 2024 presidential election Williamson County gave Donald Trump 65.36 percent and Kamala Harris 32.97, close to the state's 64.19 and 34.47, on a turnout of 73.95 percent of registered voters. In the 13 precincts that lie almost wholly inside the city, by our count, Trump won 59.65 percent and Harris 38.63. City elections are nonpartisan.
By the counts congregations report, the county is about as churched as the state. In the 2020 U.S. Religion Census, 55.0 percent of Williamson County's residents were counted as adherents of a congregation, against 55.6 percent statewide. The largest bodies were the Southern Baptist Convention, with 16.4 percent of the county's people, the Catholic Church with 9.4 and the United Methodist Church with 8.6.
The good figures are averages over everyone who already lives here. The costs are paid at the door, and they fall on a few kinds of household more than others.
A first home is the steepest step. In the census survey the median Franklin home was worth 5.9 years of the median household's income, against 4.1 in the state, and prices have kept rising since: Zillow's index is up 30.9 percent in five years. The low property tax helps a family once it is in. It does nothing for the down payment.
A starting salary does not go far. A new teacher in the county district starts at $52,124 for 2026–27, and in the FSSD at $54,811; the state's floor is $50,000. Zillow's typical asking rent in Franklin, $2,038 a month, is 47 percent of the county district's starting pay before tax. The federal government's fair market rent for a one-bedroom apartment in the 37064 ZIP code is $2,050 for the year from October 1, 2026.
The people who drive in are not, on the whole, the city's lowest-paid. In the Census Bureau's coarse earnings bands, 64.4 percent of the 79,286 jobs held by people who live outside Franklin paid more than $3,333 a month in 2023, against 59.0 percent of the jobs held by residents who work in town. Franklin is a regional job center, drawing workers from Nashville, Spring Hill and Murfreesboro alike, and the morning traffic comes with that.
Retiring here rates lower than it did. The share of residents calling Franklin a good place to retire fell from 84 percent in 2022 to 73 percent in 2025, one of the two significant drops in the city's survey, and the survey does not say why. The county's tax freeze and the state's tax relief for homeowners 65 and older, both limited by income, are in our property tax explainer; Franklin has not adopted the freeze for its city tax.
On the measures that can be counted, Franklin ranks with the best places to live in Tennessee. Its residents say so, at a rate near the top of the country. Its serious crime rate is under half the state's. Its county schools score far above the state's, on students far better off than the state's. Its county is the healthiest in Tennessee, and it has more jobs than its own residents can fill.
What it lacks is housing that costs anything like the state's. The city's survey has found the costs in the same place every time, and the share of residents calling them poor has grown since 2016: housing that one resident in five rates good, a cost of living that fewer than a third do, roads that fewer than half do. Both findings come from the same residents, which is how a place can rate 12th in the country for quality of life and 262nd for affordable housing in the same survey.
For a household that can buy in, the choice is mostly which part of the city, and our neighborhood guides cover 19 of them with prices, schools and taxes. For one that would rent, or is starting on one salary, section 09 is the place to begin. Much of the county's growth since 2020 has gone south of Franklin, where Redfin's median sale this summer was $499,752 in Spring Hill against $863,089 in Franklin; our population explainer has the figures.
Every figure on this page is from the agency or company that publishes it, read from its own files, and typed into figures.json beside this page's record with its source; the census profile is the population explainer's file and the tax rates are the property tax explainer's. A test rebuilds the hero and the figures in the prose from those files. Where we computed something ourselves (a rate per 1,000 from TBI's counts, the precincts inside the city, the commute flows from the job records), the method is in the note under the table or the sentence. The stamp at the top says when we last checked.
Next
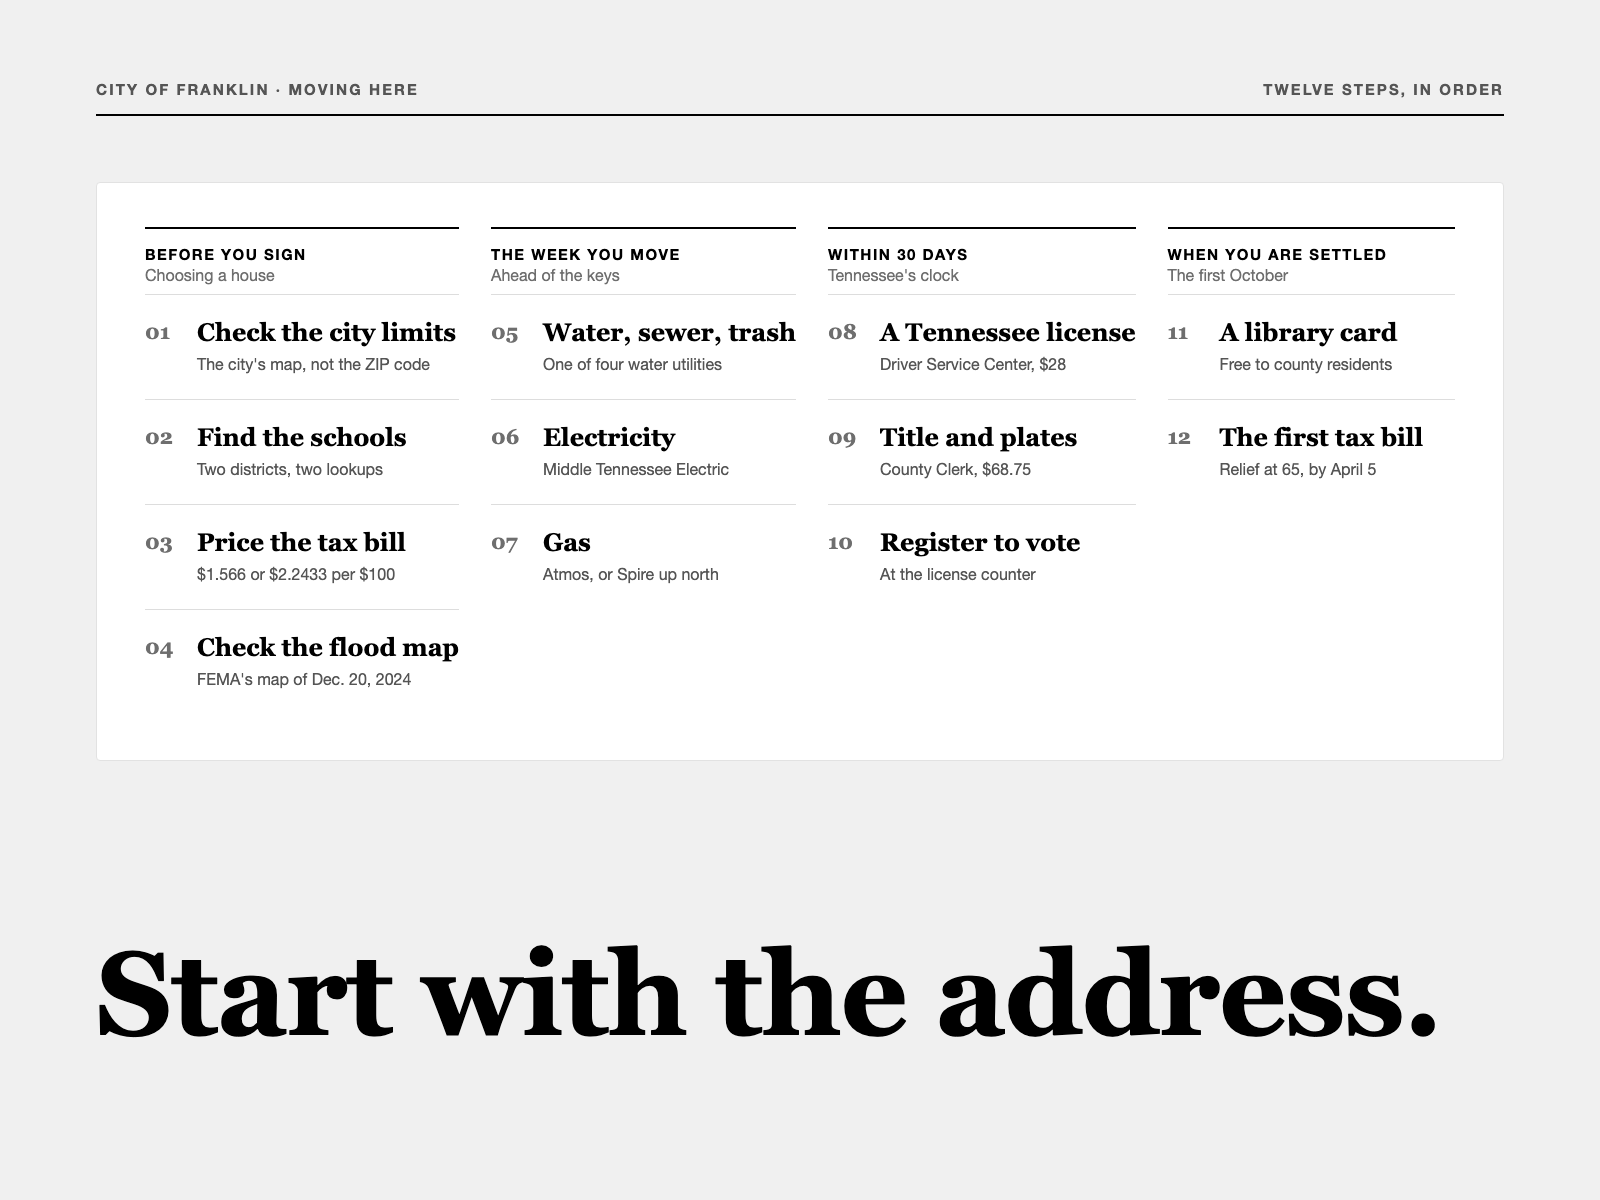
Twelve steps in the order they fall due: what to check before signing, what to start the week you move, and the 30-day clock on a license, plates and a voter registration.
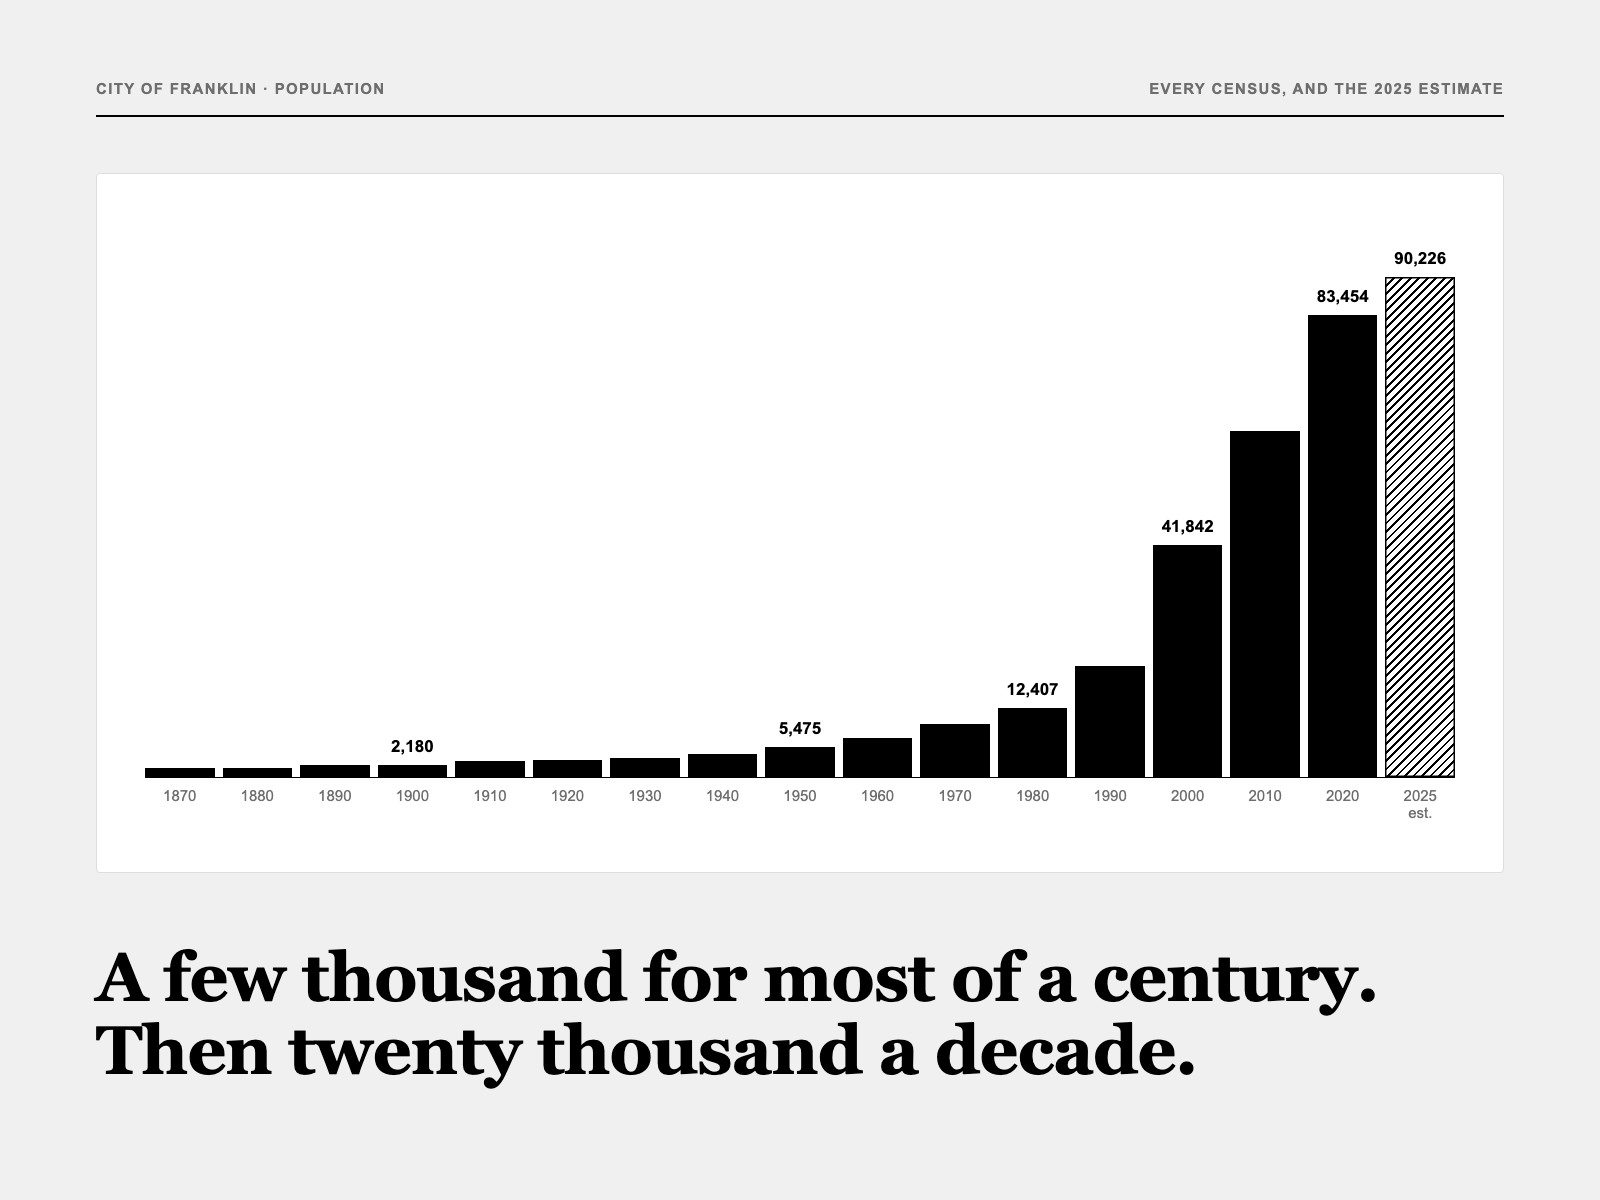
The count at every census since 1870, the Census Bureau's 2025 estimate, why the state, the city and the ZIP codes give different numbers, and where the 2010s' 21,000 newcomers went.
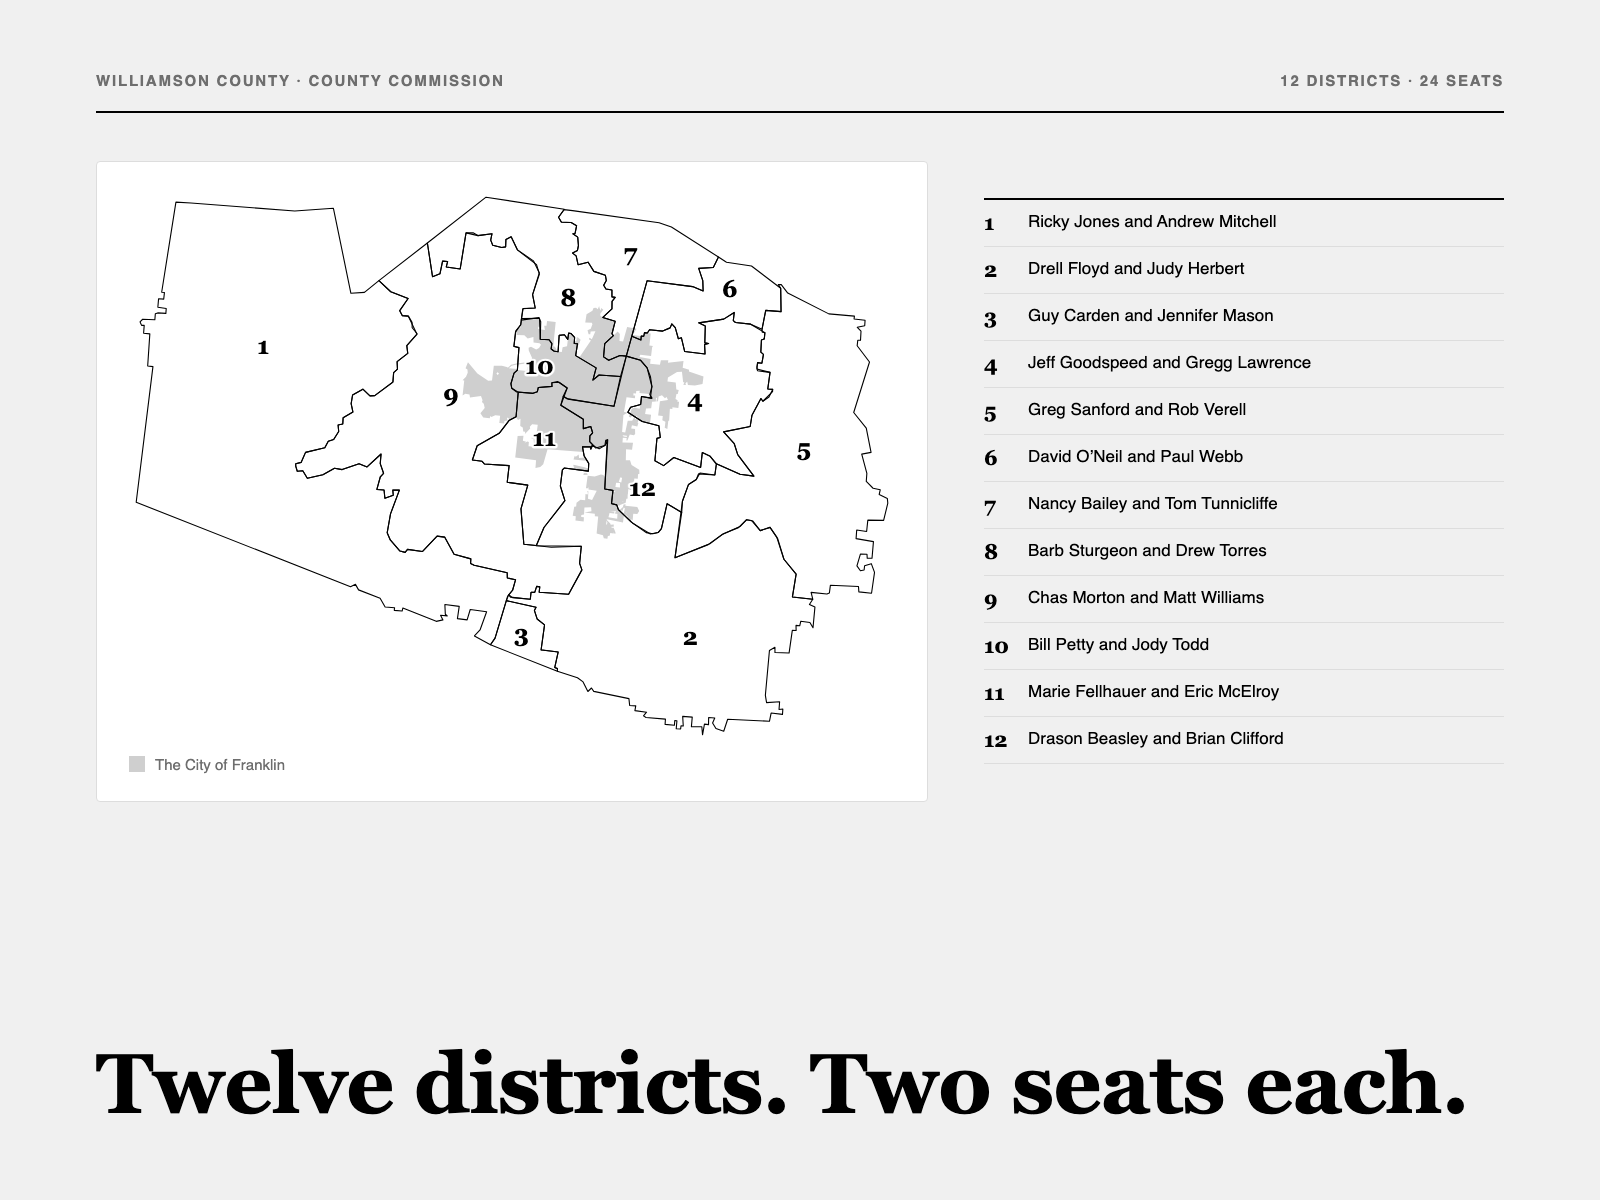
The 24 commissioners and their 12 districts, which two answer to your address, the $921.9 million budget and the tax rate they set in June, how a resolution passes with 13 votes, and how each of them voted in 2026.
The state's test results land each summer, TBI's crime report each August, the census survey each winter and Zillow's index every month. When one moves, this page is checked against it the same week, and the Monday email says what changed.