Outdoors · The weather
Franklin weather
The National Weather Service's forecast for Franklin and its watches and warnings for Williamson County, the radar, and the town's own weather record, kept once a day since 1893.
Watches and warnings for Williamson County: the National Weather Service's county page.
Now in Franklin
—°
The conditions now
- Feels like
- —
- Wind
- —
- Humidity
- —
- Sunrise
- —
- Sunset
- —
Now: Open-Meteo's model for downtown Franklin, every 15 minutes. Normal and record: the Franklin station (below).
From the National Weather Service in Nashville
The next seven days.
- The forecast comes from the National Weather Service as the page loads. Read it on weather.gov.
The forecasters' own reasoning, updated through the day: the Nashville office's forecast discussion.
Hour by hour
The next 24 hours.
- The hourly forecast comes from the National Weather Service as the page loads. Read it on weather.gov.
Temperature, sky and wind for each hour; the bar is the chance of rain, printed at 30 percent and up.
Radar
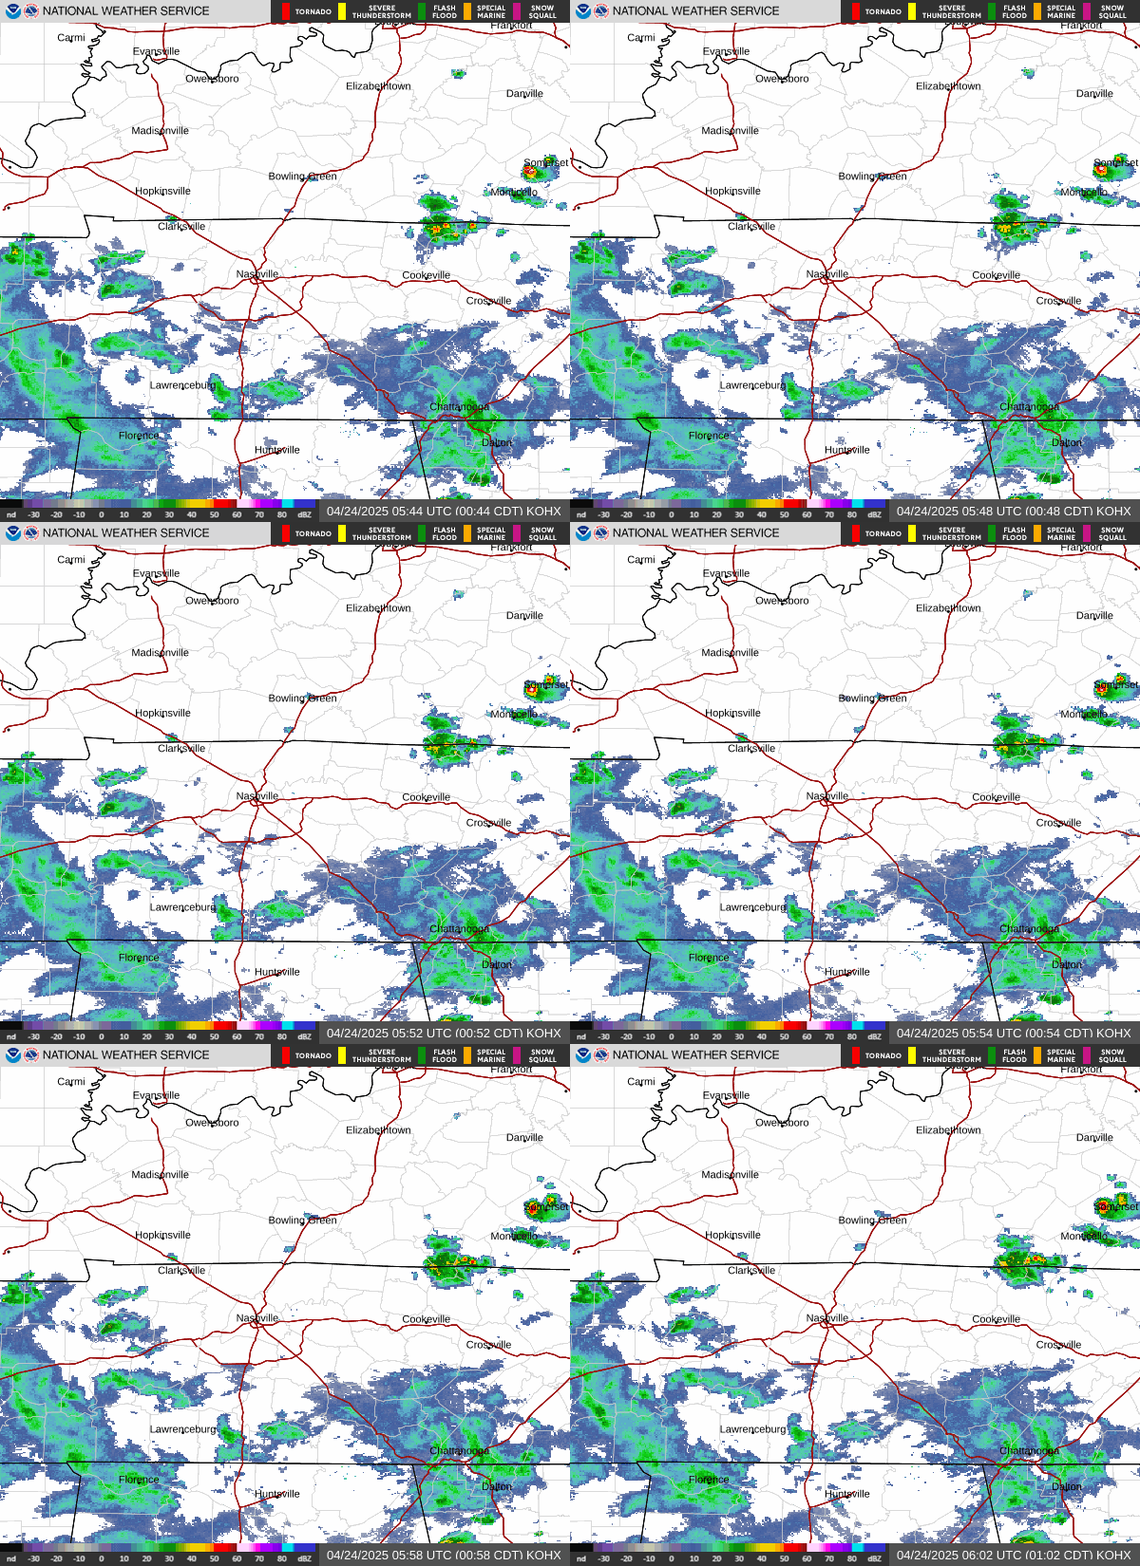
The Nashville radar, the last hour.
The Franklin station, 1991 to 2020
Franklin's year, month by month.
NOAA's normals for the town's own weather station: the average high and low for each month, and the rain and snow, over the 30 years from 1991 to 2020. The station is a National Weather Service cooperative site called Franklin Sewage Plant, 1.1 miles north of the Public Square, and it has been read once a day since 1893.
- 45 daysa year at 90° or hotter
- 84 nightsa year at 32° or colder
- April 3the last freeze of spring in a typical year; one year in ten it comes after April 20
- October 31the first freeze of fall in a typical year; one year in ten it comes before October 18
- 53.79 inof rain a year, on 130 days
- 1.7 inof snow a year, a figure NOAA marks provisional
- January: normal high 49°, normal low 29°.
- February: normal high 53°, normal low 31°.
- March: normal high 62°, normal low 38°.
- April: normal high 72°, normal low 46°.
- May: normal high 80°, normal low 55°.
- June: normal high 87°, normal low 64°.
- July: normal high 91°, normal low 69°.
- August: normal high 90°, normal low 67°.
- September: normal high 85°, normal low 60°.
- October: normal high 74°, normal low 47°.
- November: normal high 62°, normal low 37°.
- December: normal high 53°, normal low 32°.
| Month | Normal high | Normal low | Rain, in. | Snow, in. | Record high | Record low |
|---|---|---|---|---|---|---|
| January | 49° | 29° | 4.25 | 0.9 | 78° 1952 and 1949 | −22° 1985 |
| February | 53° | 31° | 4.76 | 0.3 | 83° 2023 | −15° 1899 |
| March | 62° | 38° | 5.16 | 0.4 | 93° 1907 | 0° 1980 |
| April | 72° | 46° | 5.16 | 0.0 | 94° 1965 | 21° 1942, 1924 and 1923 |
| May | 80° | 55° | 5.39 | 0.0 | 96° 1941 and 1937 | 30° 1986 |
| June | 87° | 64° | 4.39 | 0.0 | 108° 2012 | 39° 1984, 1972 and 1966 |
| July | 91° | 69° | 4.57 | 0.0 | 108° 1930 | 46° 1947 and 1944 |
| August | 90° | 67° | 3.61 | 0.0 | 106° 2007 and 1943 | 42° 1946 |
| September | 85° | 60° | 4.00 | 0.0 | 107° 1925 | 30° 1942 |
| October | 74° | 47° | 3.47 | 0.0 | 96° 2019 and 1919 | 21° 1987 and 1976 |
| November | 62° | 37° | 3.83 | 0.0 | 84° 2005 and 1946 | −3° 1950 |
| December | 53° | 32° | 5.20 | 0.1 | 79° 1964 | −11° 1989 |
| The year | 71° | 48° | 53.79 | 1.7 | 108° 2012 and 1930 | −22° 1985 |
Normals are NOAA's, for 1991 to 2020; a year's high and low are the averages of every day's. NOAA marks the snow figures provisional, built from 15 of the 30 winters, because the station did not record snowfall in the others. Records run from 1893 to October 21, 2026, checked as described below; a year listed twice is a tie.
The record book, 1893 to 2026
The hottest, the coldest, the wettest.
- Hottest
- 108° on July 12, 1930, and again in the 6 a.m. reading of June 30, 2012, which covers the afternoon before, when Nashville set its own record of 109° on June 29, 2012.
- Coldest
- −22° on January 22, 1985. Nashville's record low, −17°, was set on January 21, 1985.
- Wettest day
- 9.45 in. in the 24 hours to 6 a.m. on May 2, 2010, and 14.85 inches in two days with the next morning's reading: the flood of May 1 and 2, 2010.
- 100° and up
- 227 days since 1893. The last was 101°, in the reading of September 4, 2026. In the 1991 to 2020 normals, a year averages 1.1 of them.
- Below zero
- 89 days since 1893. The last was −2° on January 18, 2024.
How we checked the records
The station's record is a once-a-day log, and a long log has slips in it. Before treating any reading as a record we checked every high and low, 92,847 of them, against Nashville's long record for the same date and the day on either side, and set aside the 468 that were more than 10 degrees from all three. Set aside means left out, not corrected. Four of them would otherwise stand as a month's record: a high of 88° on November 9, 1906; a high of 91° on December 28, 1907; a low of 41° on August 23, 1953; and a low of 43° on July 7, 1972.
From August 1948 the thermometers were read at 5 p.m., and since April 1986, at 6 a.m., so a high logged on a date was usually reached the afternoon before. The records are listed as the observer logged them.
Field Guide 03, severe weather
When the sky turns.
The county's tornadoes, its sirens and what to do are in our severe weather guide. Four parts of it to know before the next warning:
Watch, warning, and the one that means run
A watch says a tornado is possible across a dozen counties; a warning says one is happening in a slice of one or two. And why a severe thunderstorm warning is not a throwaway.
How you will actually be told
A NOAA weather radio set to Williamson County's code, 047187, on KIG79 at 162.550 MHz; the county's text and call alerts; the phone in your pocket; and the sirens, which are for people outdoors.
The problem with night
Why most of the county's tornadoes have come after dark, and the overnight plan: one loud device you cannot sleep through, shoes by the bed, a room already chosen.
Where to go, decided in advance
The lowest floor, an inside room with no windows, a helmet and shoes kept in it, and what to do in a mobile home or a car.
Sources
Where this comes from.
- The forecast, the hourly forecast, and watches and warnings: the National Weather Service's office in Nashville, through its public data service, for its forecast point at Franklin (grid OHX 48,46), forecast zone TNZ059 and county TNC187. The same forecast on weather.gov.
- The radar: the National Weather Service's KOHX radar at Old Hickory.
- The conditions now: Open-Meteo, a model estimate for downtown Franklin updated every 15 minutes, the same one the dateline at the top of every page uses.
- Normals: NOAA's National Centers for Environmental Information, U.S. Climate Normals, 1991 to 2020, for station USC00403280 (monthly, annual, daily).
- Records: the station's daily readings since 1893 and Nashville's long record, from the Applied Climate Information System of NOAA's regional climate centers. Gathered on October 21, 2026 by
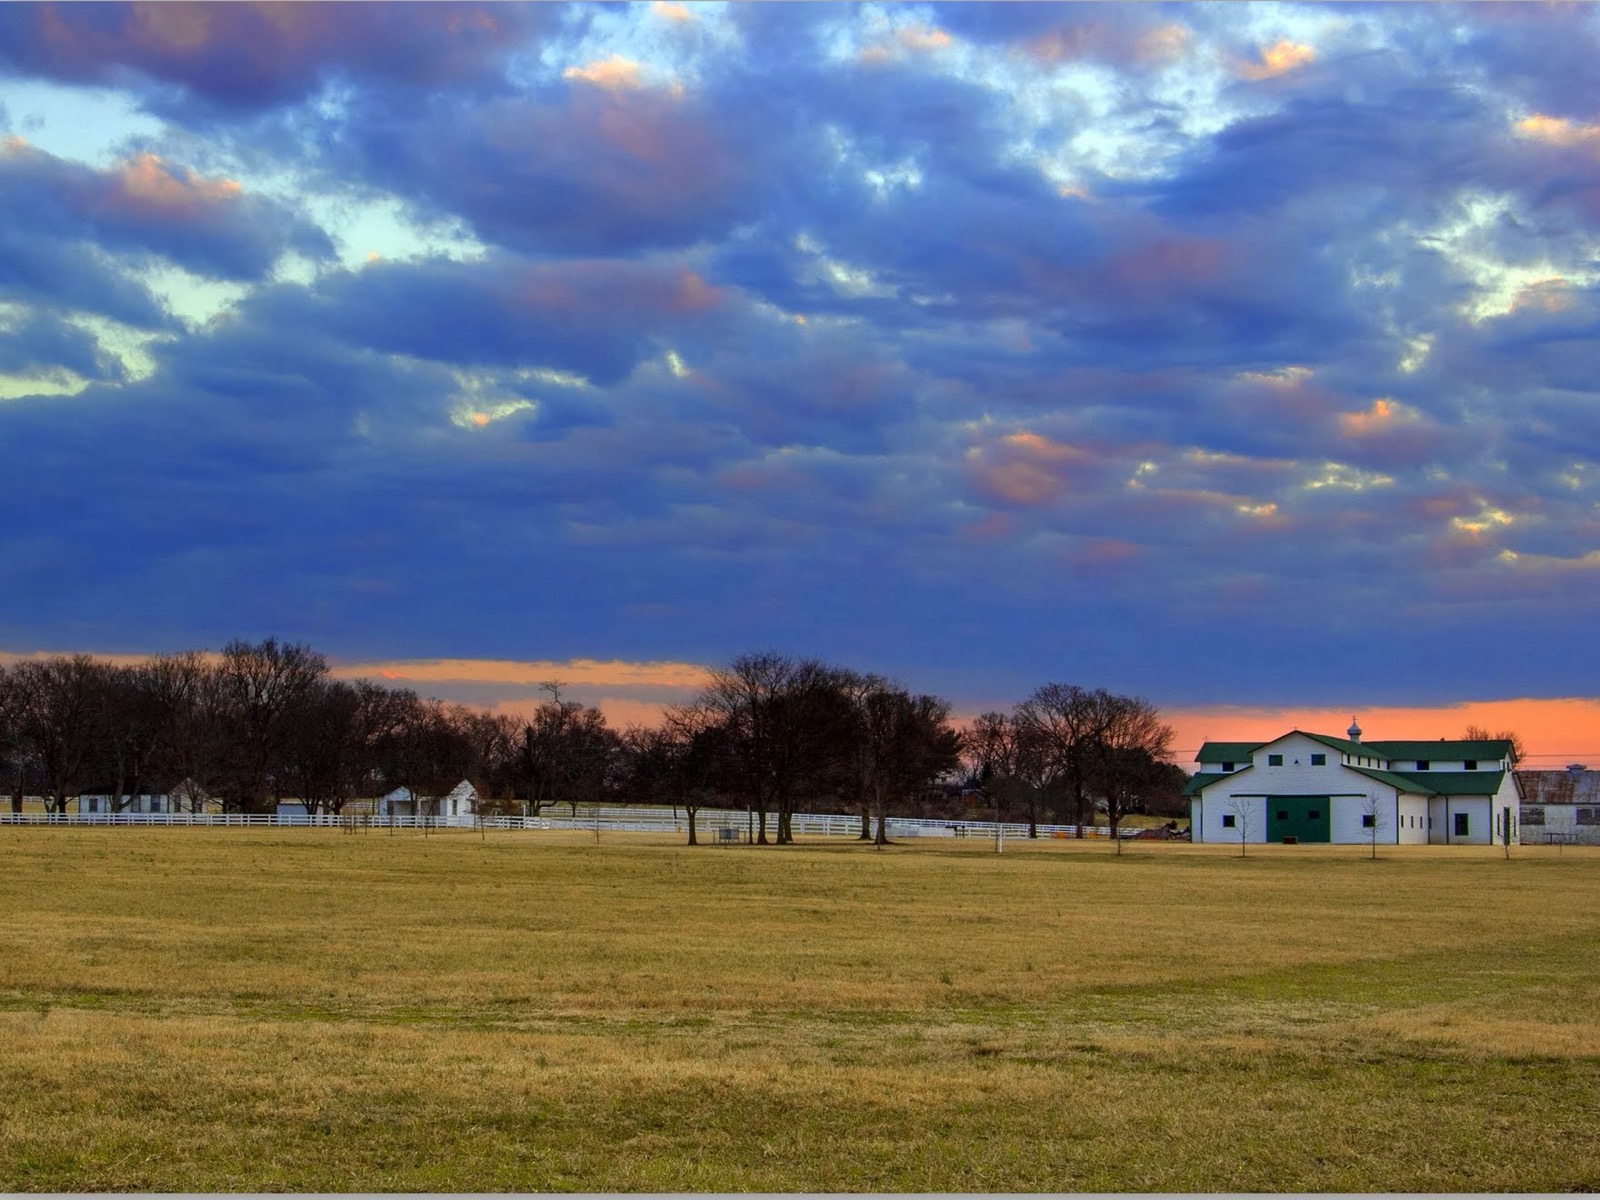
tools/franklin-climate.mjs. - The photograph: The barn at The Park at Harlinsdale Farm, Franklin, by Paula Tejo, CC BY 3.0, via Wikimedia Commons.

Next
Keep reading.
Day trips from Franklin
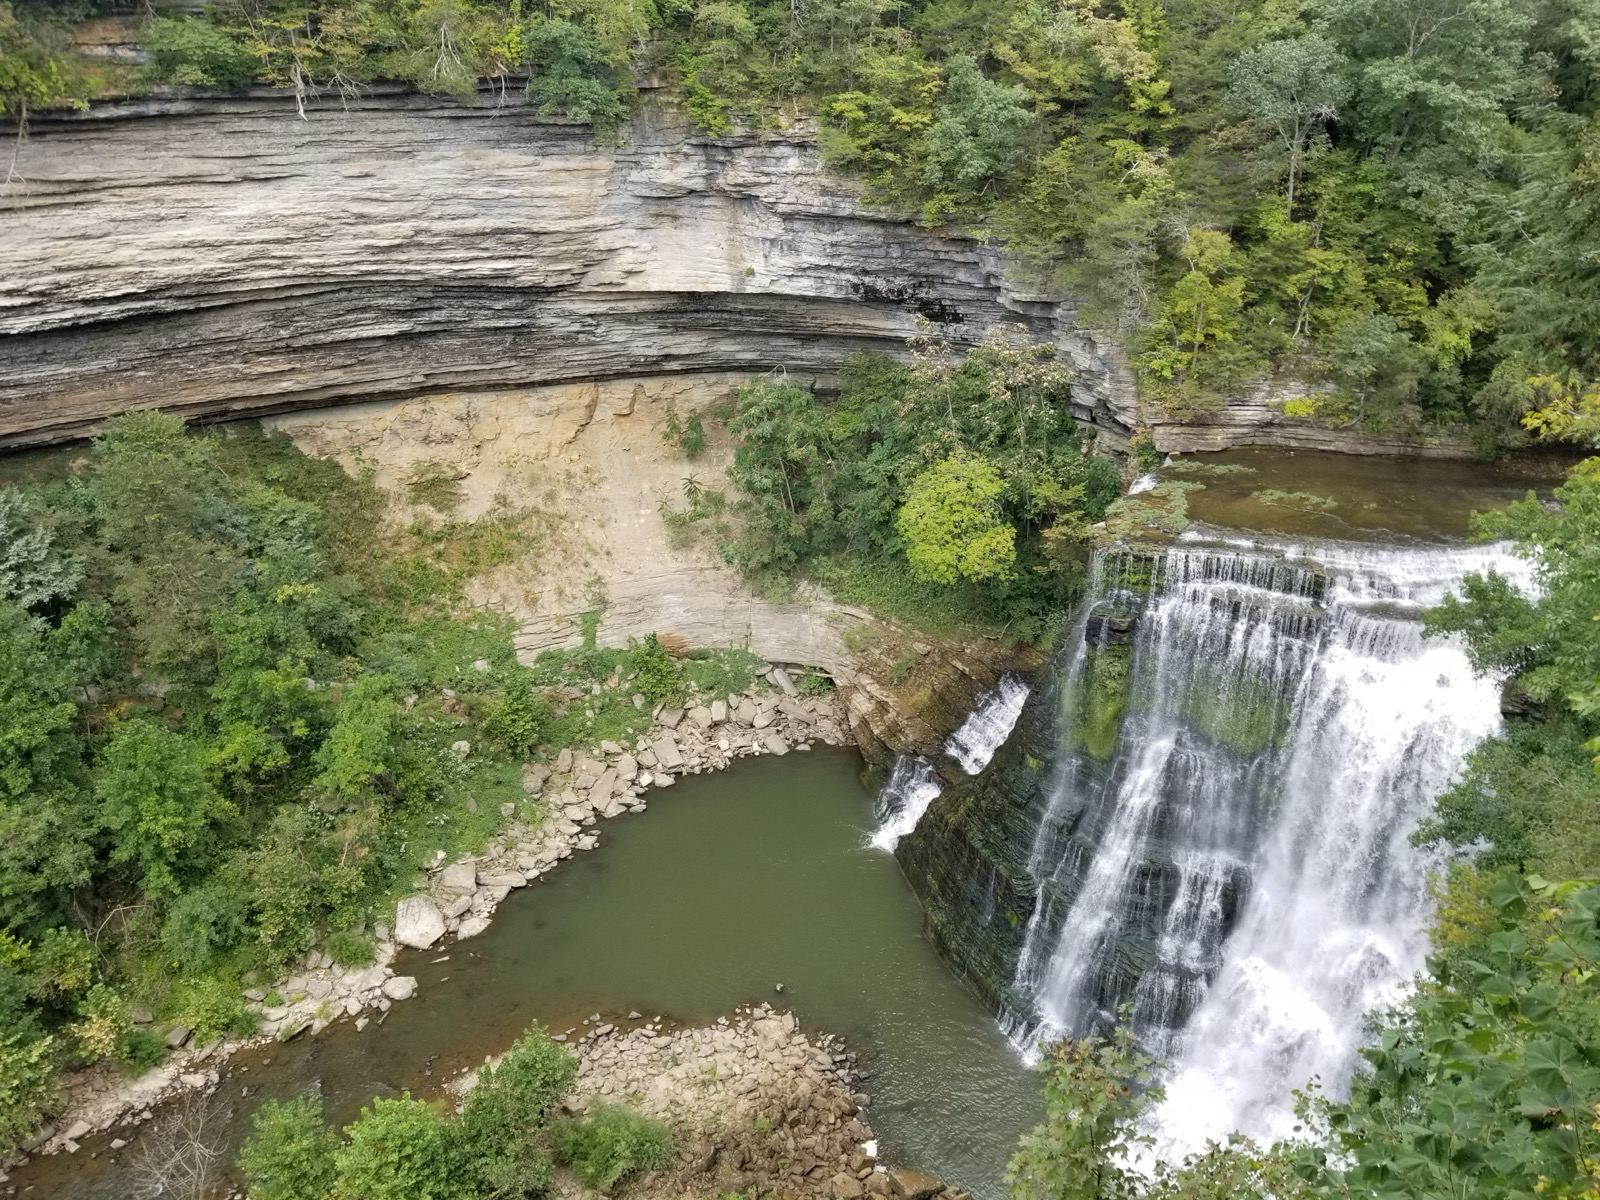
Eight Saturdays from the Public Square and back, four of four hours and four of eight, each timed against its stops' Saturday hours and the sunset.
What opened and closed in Franklin in 2026
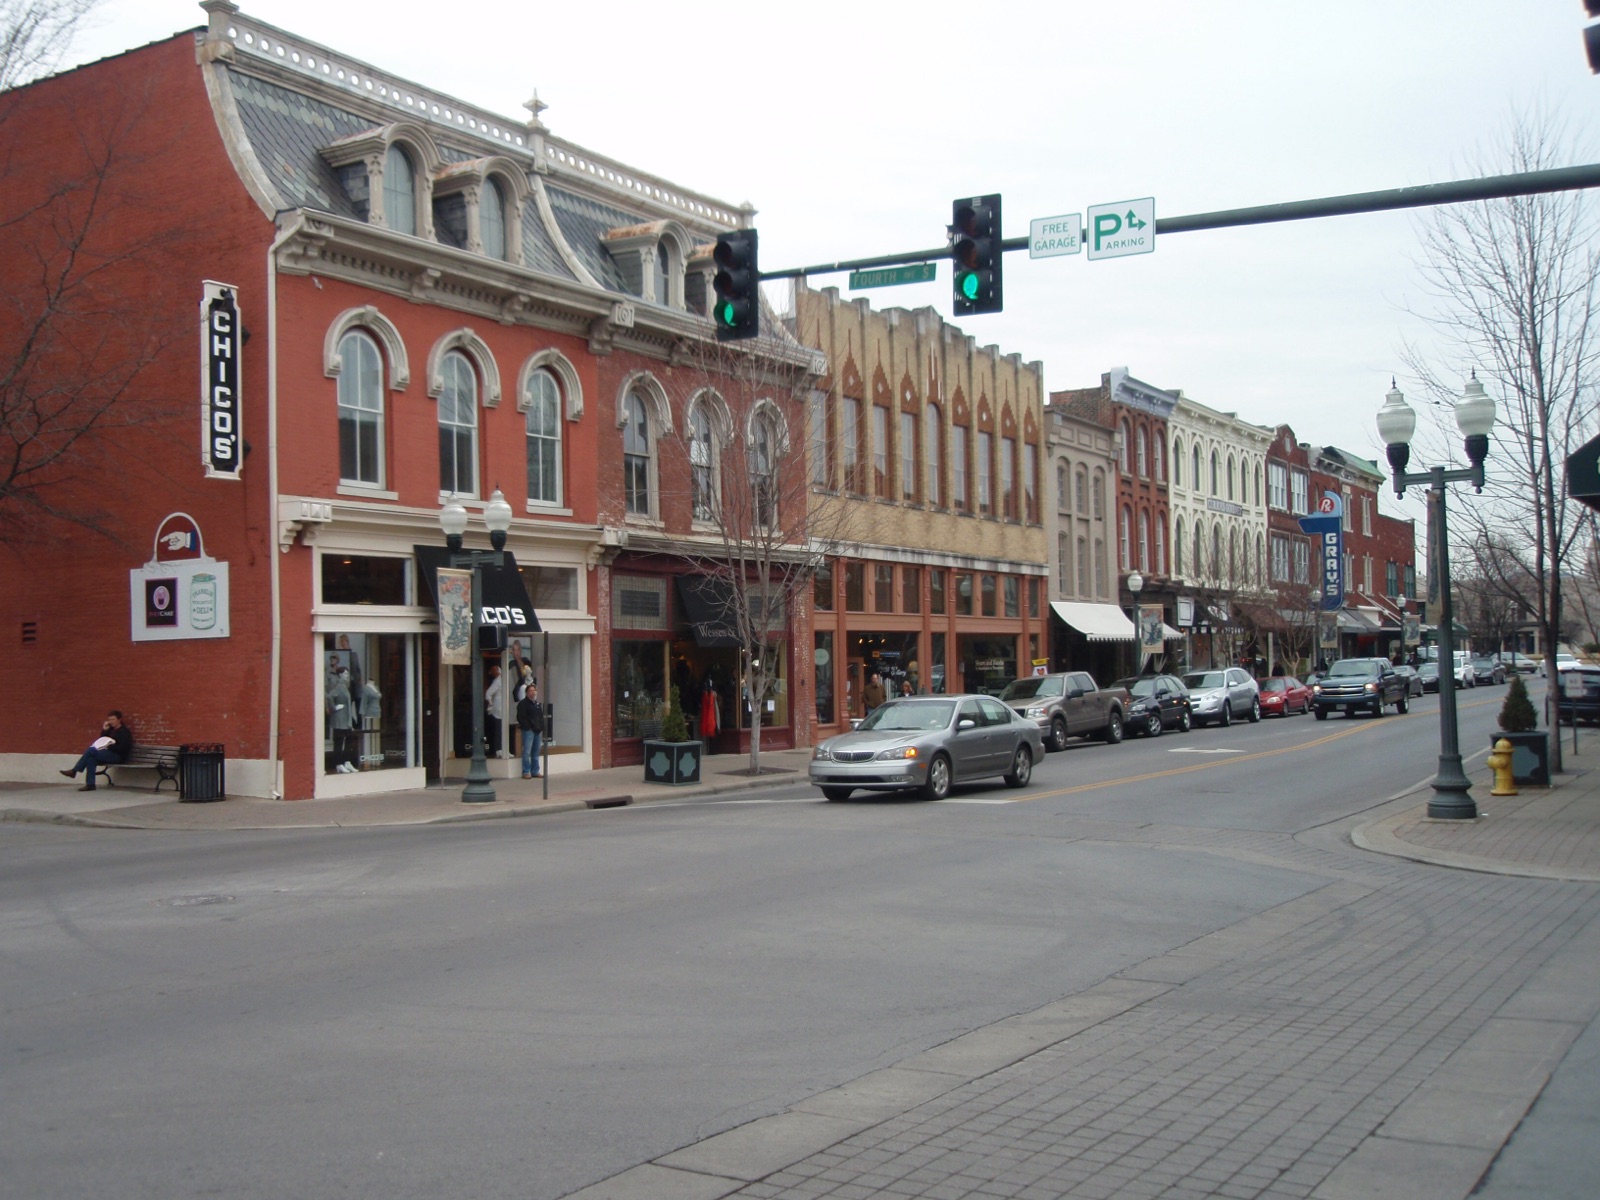
Every restaurant, bar, coffee shop and store that opened, closed or was announced at a Franklin address this year, month by month, with the date and where we read it.
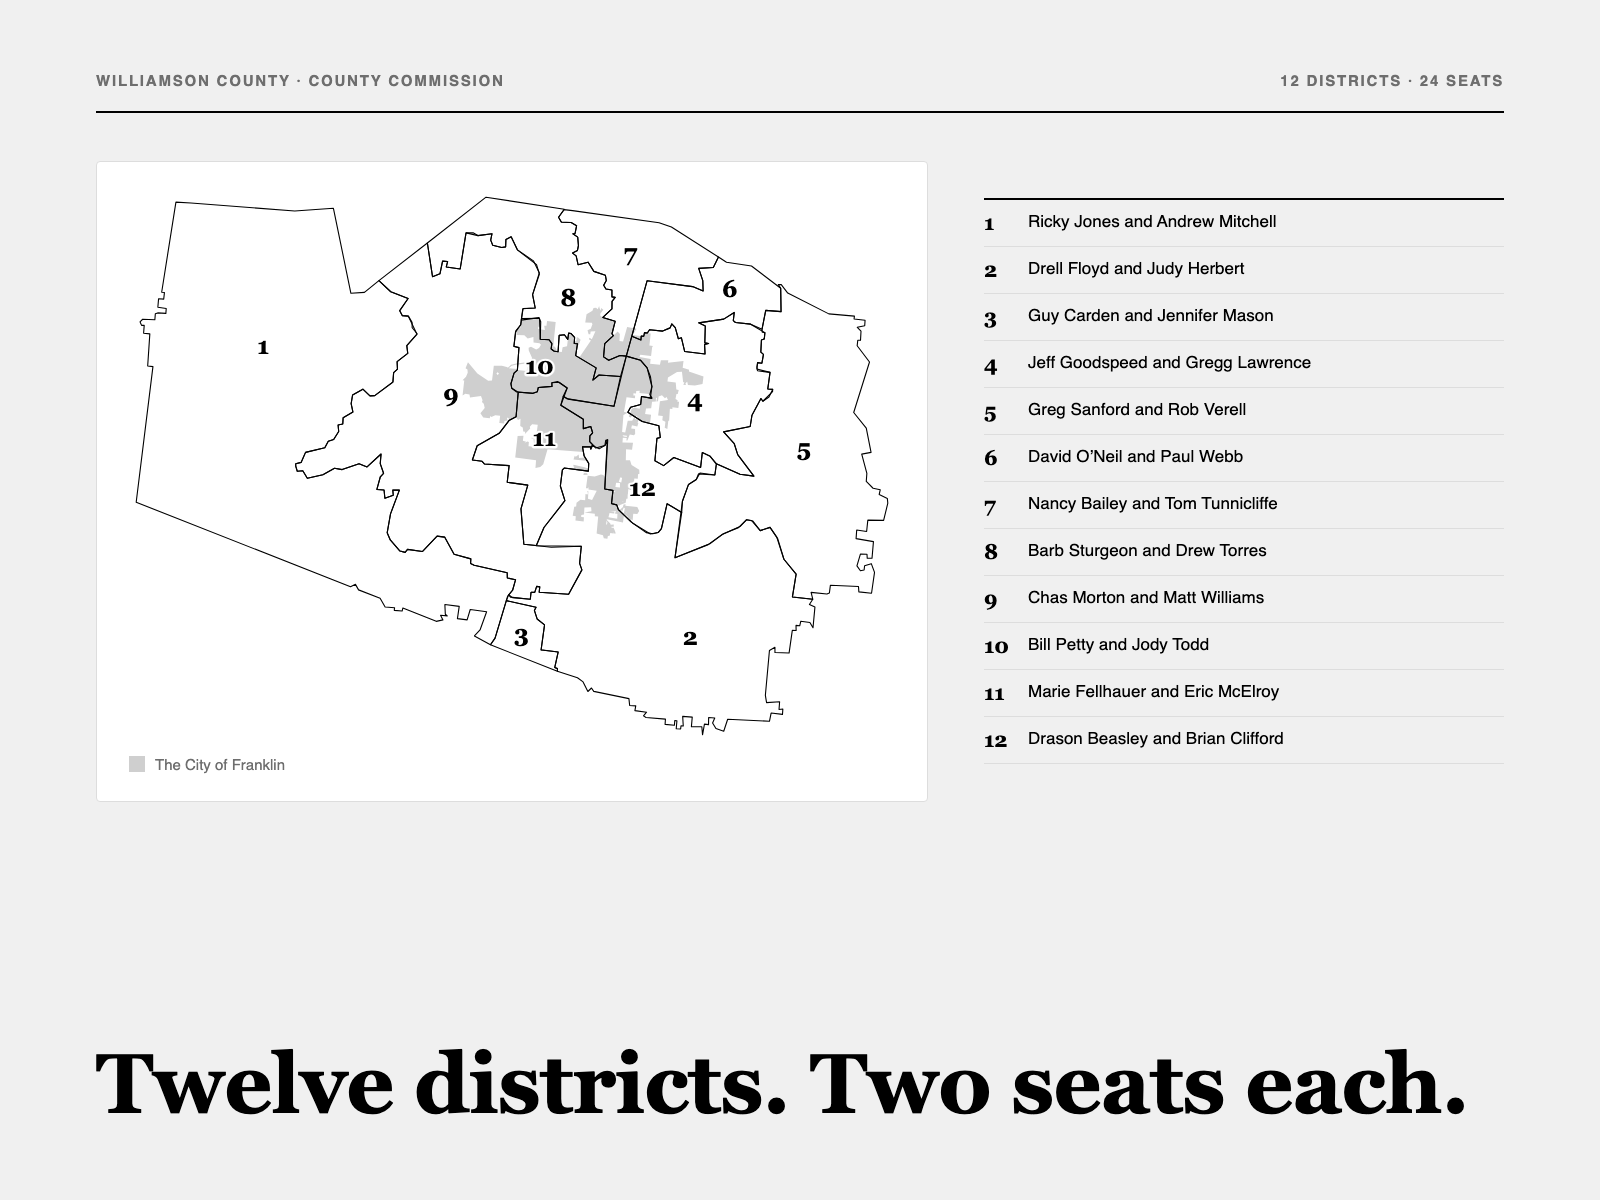
How the Williamson County Commission works
The 24 commissioners and their 12 districts, which two answer to your address, the $921.9 million budget and the tax rate they set in June, how a resolution passes with 13 votes, and how each of them voted in 2026.
Franklin Frontline
The week's weather comes with the week in Franklin.
Every Monday: the meetings, the openings, what is being built and the week's forecast. Every Thursday: five picks for the weekend, and whether it will rain on them.