83,454
People the census counted in Franklin on April 1, 2020
How Franklin works · Population
The 2020 census counted 83,454 people in Franklin, a third more than in 2010. The Census Bureau now estimates 90,226, and the city's planners say nearly 94,000. Which number is which, how many of the newcomers the city annexed and how many it built for, where in Franklin they went, where they were born, and why the towns to the south are now growing faster.
Franklin at every censusPeople inside the city limits
The last census, taken as of April 1, 2020, counted 83,454 people living inside Franklin's city limits. That was 20,967 more than in 2010, a gain of 33.6 percent, and it made Franklin the seventh-largest city in Tennessee, behind Nashville, Memphis, Knoxville, Chattanooga, Clarksville and Murfreesboro. It still is.
The census is taken once a decade. In between, the Census Bureau estimates, and its latest estimate, published in May 2026, puts Franklin at 90,226 on July 1, 2025. Since July 1 that is also the number the State of Tennessee certifies for the city, which it uses to share out state taxes. The city's own planners put the number higher, at 93,921 at the end of 2025, and the three ZIP codes on Franklin mail held 114,719 people in 2020. Section 02 says which figure is which.
Franklin has added about 20,000 people in each of the last three decades. The pace has slowed since 2020, to about 1,300 a year from about 2,100 a year in the 2010s, while the towns south of it have sped up: since 2020 Thompson's Station has grown 27 percent and Spring Hill's Williamson County side 18 percent, against Franklin's 8. Almost none of the 2010s' growth came from annexation. It came from building on land the city already held: Ladd Park in the southeast, Westhaven in the west, and apartments along Carothers Parkway. Most of the people who moved in came from somewhere else: about a third of Franklin's residents were born in Tennessee.
Search for Franklin's population and you will find at least five figures, each correct for what it counts. The census counts everyone in the city limits on one day every ten years. Everything else is an estimate, a different boundary, or a number someone copied.
| The number | What it counts | Where you will see it |
|---|---|---|
| 83,454 | Everyone the 2020 census counted inside the city limits as of April 1, 2020 | The census itself; the ward lines the board drew in 2022; the state's certified figure until June 30, 2026 |
| 90,226 | The Census Bureau's estimate for July 1, 2025, published May 2026 | The state's certified population since July 1, 2026; most rankings of cities |
| 93,921 | The city planning department's estimate for December 31, 2025: its count of homes, 39,959, times 2.35 people per home | The city's 2025 Development Report |
| 88,558 | The Census Bureau's estimate for July 1, 2023, as it first published it in May 2024 | The city's audited financial report for the year to June 30, 2025, as its "certified population" |
| 114,719 | Everyone the 2020 census counted in ZIP codes 37064, 37067 and 37069, inside the city or out | Real estate sites and anything ranked by ZIP code |
The census count is for the city as its limits stood on January 1, 2020. The ZIP code figures are the census's ZIP Code Tabulation Areas: 37064 had 62,422 people, 37067 had 31,465 and 37069 had 20,832.
The ZIP codes are the widest net. 37064 alone covers about 184 square miles, four times the city, and runs out to Leiper's Fork; a Franklin mailing address says nothing about whether a house is inside the limits, as our trash pickup explainer found house by house. In 2020 the three ZIP codes held 31,265 more people than the city.
The city's estimate runs 3,695 above the Census Bureau's because the two are built differently. The Bureau estimates the county first, from births, deaths and people moving in and out, and then shares the county's total among its towns according to the homes each has added. The planning department multiplies its own count of homes by its own household size. Neither is a count. The 88,558 in the city's financial report is a different matter: the report calls it the city's certified population as of June 30, 2025, but the state's certified figure on that date was 83,454, and 88,558 is the Bureau's estimate for July 2023 as first published.
The certified population is the one that moves money. Tennessee shares part of its sales, fuel and other taxes with its cities by population, and until this year the population it used changed only with a census, federal or special, or a count of the people in land a city annexed. A city could pay for its own count between federal ones, and Franklin did, five times.
| Certified | Population | From |
|---|---|---|
| After the 2000 census | 41,842 | The federal census |
| For the 2003–04 fiscal year | 46,416 | A special census |
| 2005–06 | 49,412 | A special census |
| 2007–08 | 56,219 | A special census |
| After the 2010 census | 62,487 | The federal census |
| 2013–14 | 66,370 | A special census |
| 2016–17 | 70,908 | A special census |
| After the 2020 census | 83,454 | The federal census |
| From July 1, 2026 | 90,226 | The Census Bureau's 2025 estimate, under Public Chapter 501 |
The Tennessee Department of Economic and Community Development's certified population reports of 2009, 2017 and 2026. A special census is certified for the state's fiscal year, July to June.
After 2020 the city tried a sixth. Forms went out in October 2024, and the board's December 10 agenda carried a contract for the Greater Nashville Regional Council to check a tenth of the count, for no more than $87,969. In March 2025 WKRN reported that Franklin's count, like those in Smyrna, Murfreesboro and Goodlettsville, had fallen thousands short of what city leaders projected, and that Franklin's administrator backed a bill to let outside estimates stand in for a special census. No Franklin special census has been certified since 2020.
A bill along those lines passed. Public Chapter 501 of 2025, enacted May 21, 2025, has the state certify every city's and county's population each year from estimates the University of Tennessee's Boyd Center produces, and a city can still hold a special census if it thinks the estimate is low. For the first certification, on July 1, 2026, the Boyd Center used the Census Bureau's 2025 estimates as they stood, and Franklin's certified population went from 83,454 to 90,226. The next certification, from the Bureau's 2026 estimates, is due July 1, 2027.
Franklin was a county seat of about 1,500 people when the census first printed a count for it, in 1870; the 1850 report gave only its free population, 891, and the 1860 report gave no figure for the town. For most of the next century it grew slowly, passing 3,000 in 1920 and 5,000 in 1950. Williamson County as a whole had fewer people in 1960, 25,267, than it had in 1850, 27,201.
The growth began after that. The city added about 2,500 people in the 1960s, 2,900 in the 1970s and 7,700 in the 1980s, then more than doubled in the 1990s, from 20,098 to 41,842. It has added about 20,000 people in every decade since.
| Census | People | Added | Growth |
|---|---|---|---|
| 1870 | 1,552 | – | – |
| 1880 | 1,632 | 80 | 5.2% |
| 1890 | 2,250 | 618 | 37.9% |
| 1900 | 2,180 | −70 | −3.1% |
| 1910 | 2,924 | 744 | 34.1% |
| 1920 | 3,123 | 199 | 6.8% |
| 1930 | 3,377 | 254 | 8.1% |
| 1940 | 4,120 | 743 | 22.0% |
| 1950 | 5,475 | 1,355 | 32.9% |
| 1960 | 6,977 | 1,502 | 27.4% |
| 1970 | 9,497 | 2,520 | 36.1% |
| 1980 | 12,407 | 2,910 | 30.6% |
| 1990 | 20,098 | 7,691 | 62.0% |
| 2000 | 41,842 | 21,744 | 108.2% |
| 2010 | 62,487 | 20,645 | 49.3% |
| 2020 | 83,454 | 20,967 | 33.6% |
The count on each census day, for the city limits of the time. 1870 to 1990 are from the published census volumes, listed in the sources; 1970 is the count as the Bureau revised it in 1980, first published as 9,404. 2000 to 2020 are from the Bureau's data files. The download has every count and every annual estimate.
The census counts are for the city limits of their day, and the limits have moved. By the city's own figures Franklin covered 1.9 square miles in 1960, 8.5 by the end of the 1970s and 24.3 by the end of the 1980s; it reached 41.5 in the 2000s and has added only 3.4 since, to 44.9 today. Most of the land came in the 1980s and 2000s, much of it as farmland, and filled in later.
That is why the 2000s and the 2010s added nearly the same number of people for different reasons. Counted inside the limits the city had by 2010, the 2000 census would have found 45,838 people instead of 41,842: about 4,000 of the 2000s' growth came with land the city annexed during the decade. The 2010s were almost all building. Of the 83,454 people counted in 2020, 82,775 lived on land that was already inside the city in 2010; 679 lived on land annexed during the decade. The city's homes rose from 25,586 to 34,720, and it issued permits for 9,285 new ones over the ten years.
The south and the east took most of it. On the ward lines the board adopted in 2022, Ward 3, the south, grew 58 percent between the two censuses and Ward 1, the east and southeast, 39 percent. Together they added 13,893 people, two-thirds of the city's growth. Ward 2 in the north added the fewest.
The two darkest tracts are the southeast, where Ladd Park went up in the 2010s with Lockwood Glen, Water's Edge and Simmons Ridge beside it, and the west, where Westhaven, approved in 2000 for 2,750 homes, roughly doubled its population and Through the Green filled in next to it. Each added more than 3,700 people. Next came the two tracts along Carothers Parkway, which added more than 2,200 each: in the northeast, near Cool Springs Boulevard, almost all of it in apartment complexes, and in the east in apartments off the parkway and in newer neighborhoods such as Amelia Park and the Village of Clovercroft. The tracts farther south, around Berry Farms and Stream Valley, added about 700 and 1,100 people. Downtown's own tract barely changed.
| Ward | People, 2010 | People, 2020 | Added | Growth |
|---|---|---|---|---|
| Ward 1, the east and southeast | 15,543 | 21,671 | 6,128 | 39.4% |
| Ward 2, the north and northeast | 17,939 | 20,345 | 2,406 | 13.4% |
| Ward 3, the south | 13,335 | 21,100 | 7,765 | 58.2% |
| Ward 4, downtown and the west | 16,517 | 20,784 | 4,267 | 25.8% |
Our count, on today's ward lines and city limits, so it includes land annexed since 2010 and the 2020 figures for Wards 1 and 3 run a little above the city's redistricting charts. The two censuses used different blocks; each 2010 block's people are spread over the 2020 blocks it overlaps, by shared land area, using the Census Bureau's block relationship file. The board explainer has the ward lookup.
Between censuses there is no count, only the Census Bureau's estimates, published each May for July 1 of the year before. Each release revises every year back to the last census, so a figure for 2024 published in 2025 is not the figure for 2024 published in 2026. The 2025 release put Franklin at 89,142 on July 1, 2024; the 2026 release puts it at 88,921. The table is the 2026 release.
| July 1 | Estimate | Added in the year before |
|---|---|---|
| 2020 | 84,159 | 603 since April 1 |
| 2021 | 85,974 | 1,815 |
| 2022 | 87,590 | 1,616 |
| 2023 | 88,666 | 1,076 |
| 2024 | 88,921 | 255 |
| 2025 | 90,226 | 1,305 |
U.S. Census Bureau, Vintage 2025 population estimates for incorporated places, May 2026. The estimates start from a base of 83,556 for April 1, 2020: the census count, adjusted for corrections and for boundary changes reported since.
The city figures are built from housing. The Bureau shares out each county's estimate by the homes each town has added, which it estimates from building permits, so a slow year for permits shows up in the estimate. Franklin permitted 306 new homes in 2023, the fewest since 2010 and none of them apartments, and its estimate grew by 255 people between July 2023 and July 2024. In 2024 it permitted 945, including 538 apartments, and the estimate picked up again.
HousesApartments, duplexes and other buildings of two or more homes New homes authorized by building permits in the City of Franklin, by year. U.S. Census Bureau, Building Permits Survey, annual place files.
The estimates can drift a long way in ten years. The Bureau's last estimate before the 2020 census put Franklin at 84,796 on April 1, 2020; the census counted 83,454, 1,342 fewer. The 2030 census will show how close the current series has come.
Franklin is mostly people who were born somewhere else. The Census Bureau's American Community Survey, which asks a sample of households every year and reports five years at a time for a city this size, finds that about 35 percent of Franklin's residents were born in Tennessee, against 57 percent of Tennesseans as a whole. About 52 percent were born in another state and 12 percent in another country.
Where Franklin's residents were born. American Community Survey, 2020–2024 five-year estimates, table B05002. The rest, 1.8 percent, were born abroad to American parents or in Puerto Rico. Each share has a margin of error of a point or two.
The county's figures show the same thing as a flow. Since the 2020 census, Williamson County has grown by an estimated 24,271 people. Births outnumbered deaths by 3,168. The rest came from moving: a net 17,605 from elsewhere in the United States and 3,885 from abroad. Net moves from elsewhere in the country account for seven of every ten people the county has added since 2020, though the stream has thinned, from a net 6,080 in the year to July 2021 to 2,274 in the year to July 2025.
| Year to July 1 | Births | Deaths | Moved in from the U.S., net | From abroad, net | Change |
|---|---|---|---|---|---|
| 2020, from April 1 | 560 | 386 | 1,701 | 6 | 1,824 |
| 2021 | 2,230 | 1,712 | 6,080 | 116 | 6,578 |
| 2022 | 2,406 | 1,746 | 3,730 | 839 | 5,143 |
| 2023 | 2,279 | 1,568 | 2,081 | 838 | 3,563 |
| 2024 | 2,177 | 1,623 | 1,739 | 1,324 | 3,588 |
| 2025 | 2,186 | 1,635 | 2,274 | 762 | 3,575 |
| April 2020 to July 2025 | 11,838 | 8,670 | 17,605 | 3,885 | 24,271 |
Williamson County's components of change, Census Bureau Vintage 2025 estimates. The 2020 row is April 1 to July 1, 2020. The change includes a small residual the Bureau cannot assign, 387 people over the period. The Bureau does not publish these components for cities.
Tax returns show where the movers come from. In the IRS's latest county-to-county figures, from returns filed in 2022 and 2023, 18,077 people moved into Williamson County and 15,636 moved out. Davidson County sent the most, 4,157, then Maury with 1,033 and Rutherford with 745; the next two were Orange County and Los Angeles County, California, and the California counties the IRS names sent at least 1,832 people between them. On balance the county takes people from Nashville and sends them south and east: it gained 988 from Davidson but lost 1,149 to Maury and 377 to Rutherford.
In the survey's five years, 15.4 percent of Franklin residents had moved in the previous twelve months: 6.2 percent from another Tennessee county, 4.4 percent from another state, and most of the rest within Williamson County.
The survey also gives the profile of the city. Franklin is a little younger than the county around it and has a larger share of renters, more Asian and Hispanic residents, and a lower median income than the county, though at $119,528 it is still well above the state's. Nearly two adults in three hold a bachelor's degree.
| 2020–2024 | Franklin | Williamson County | Tennessee | United States |
|---|---|---|---|---|
| Median age | 38.6 | 40.4 | 38.9 | 38.9 |
| Under 18 | 23.4% | 25.8% | 22.2% | 22.0% |
| 65 and older | 14.7% | 14.8% | 17.1% | 17.2% |
| White | 74.4% | 80.9% | 71.0% | 57.4% |
| Black | 5.3% | 3.9% | 15.4% | 11.9% |
| Asian | 8.2% | 5.3% | 1.9% | 5.9% |
| Hispanic or Latino | 8.1% | 6.0% | 7.4% | 19.3% |
| Born in the state | 34.7% | 38.6% | 57.2% | 57.3% |
| Born in another state | 51.6% | 51.6% | 35.7% | 26.9% |
| Born in another country | 11.9% | 8.5% | 6.1% | 14.1% |
| Bachelor's degree or more, age 25 and up | 64.5% | 62.7% | 31.1% | 35.7% |
| Households | 33,998 | 92,214 | 2,824,277 | 129,227,496 |
| People per household | 2.54 | 2.81 | 2.45 | 2.53 |
| Homes lived in by their owners | 63.8% | 78.8% | 66.9% | 65.2% |
| Median household income | $119,528 | $135,594 | $69,595 | $80,734 |
| Median home value | $705,400 | $751,900 | $286,700 | $332,700 |
| Median rent | $1,923 | $1,969 | $1,189 | $1,413 |
American Community Survey, 2020–2024 five-year estimates (released January 2026), tables B01001, B01002, B03002, B05002, B11001, B15003, B19013, B25003, B25010, B25064 and B25077. The race rows are people who are not Hispanic; Hispanic people may be of any race. Franklin's median household income has a margin of error of $6,576. "Born in the state" is born in the state the person lives in.
Apartments are most of what comes next. More than half the homes Franklin has permitted since 2020 were in apartment buildings, and 9,307 of the 13,203 homes the city has approved but not yet seen built are apartments.
Franklin is a third of Williamson County and took a little more than a quarter of its growth since 2020. The fastest growth is now south of it, in Thompson's Station and Spring Hill. The county's unincorporated land added nearly as many people as Franklin did, and Brentwood has not grown at all.
| Williamson County | April 2020 | July 2025 | Added | Growth |
|---|---|---|---|---|
| Franklin | 83,556 | 90,226 | 6,670 | 8.0% |
| Spring Hill, its Williamson County part | 33,563 | 39,711 | 6,148 | 18.3% |
| Unincorporated | 54,648 | 60,676 | 6,028 | 11.0% |
| Thompson's Station | 7,444 | 9,469 | 2,025 | 27.2% |
| Nolensville | 13,817 | 15,789 | 1,972 | 14.3% |
| Fairview | 9,385 | 10,877 | 1,492 | 15.9% |
| Brentwood | 45,377 | 45,313 | −64 | −0.1% |
| Williamson County | 247,790 | 272,061 | 24,271 | 9.8% |
Census Bureau Vintage 2025 estimates; the April 2020 column is the estimates base. Spring Hill is its Williamson County part only; the whole city, with its Maury County side, grew from 50,676 to 61,336. "Unincorporated" is everything outside a town.
Across Tennessee the pattern is the same. Of the state's cities with 20,000 or more people, the fastest-growing since 2020 are the outer ring around Nashville: Lebanon up 39 percent, Gallatin 23, Spring Hill 21, Columbia 20 and Smyrna 19. Franklin's 8.0 percent is ahead of the state's 5.8 and of Nashville's 4.6. It is still the seventh-largest city in the state, about 15,000 ahead of Johnson City and some 81,000 behind Murfreesboro.
What Franklin has already approved sets the near future. At the end of 2025 the planning department counted 13,203 homes approved but not yet built, 71 percent of them apartments, on top of 39,959 that exist. At the department's 2.35 people a home, the approved homes alone would hold about 31,000 people, and the city's full build-out of what it has approved would be 53,162 homes.
Beyond the limits is the city's urban growth boundary, the land Tennessee's 1998 growth law reserves for Franklin to annex. The city's map draws it at 73.95 square miles, about 30 more than the city itself, and in 2020 about 11,100 people lived in the part of it outside the city. That land joins the city one annexation at a time.
| Projection | Made | 2030 | 2040 | 2050 |
|---|---|---|---|---|
| City of Franklin, 2025 Development Report | March 2026 | 102,996 | 122,266 | – |
| Envision Franklin, the city's land use plan | 2024 | 106,409 | 128,089 | – |
| Greater Nashville Regional Council, people in households | 2025 | – | – | 161,404 |
| Boyd Center, all of Williamson County | 2024 | 304,573 | 362,863 | 420,662 |
The city's projections extend its historical growth averages. The regional council's is its forecast for the 2050 Regional Transportation Plan, counting people in households from a 2023 base of 90,053. The Boyd Center projects counties only; its 2025 figure for Williamson County, 277,193, already runs about 5,100 above the Census Bureau's estimate.
The Development Report's projection adds about 1,800 people a year to the department's own estimate, faster than the Census Bureau's estimates have shown since 2020 and slower than the 2010s. The regional council's has the city growing by 79 percent from 2023 to 2050.
The next figures arrive on a schedule. The Census Bureau publishes its 2026 estimates for counties in March 2027 and for cities in May 2027, and the state certifies from them on July 1, 2027. The next count is the 2030 census, taken as of April 1, 2030, with the first city totals due by April 2031. They will set the ward lines for the 2031 and 2033 elections.
Every count and estimate is the Census Bureau's, from the files it posts at www2.census.gov and its TIGERweb map service, gathered by tools/franklin-population.mjs into one file, which the tables, the chart, the map and the download all read. The counts before 2000 are typed from the census volumes. The block-level work is ours: which 2020 blocks lie inside the 2010 limits, the wards and the tracts, each block placed at the internal point the Bureau publishes for it and each 2010 block's people spread over the 2020 blocks it overlaps by shared land. The city's figures are its own documents, the state's its certified population reports. The stamp at the top says when we last checked.
Next
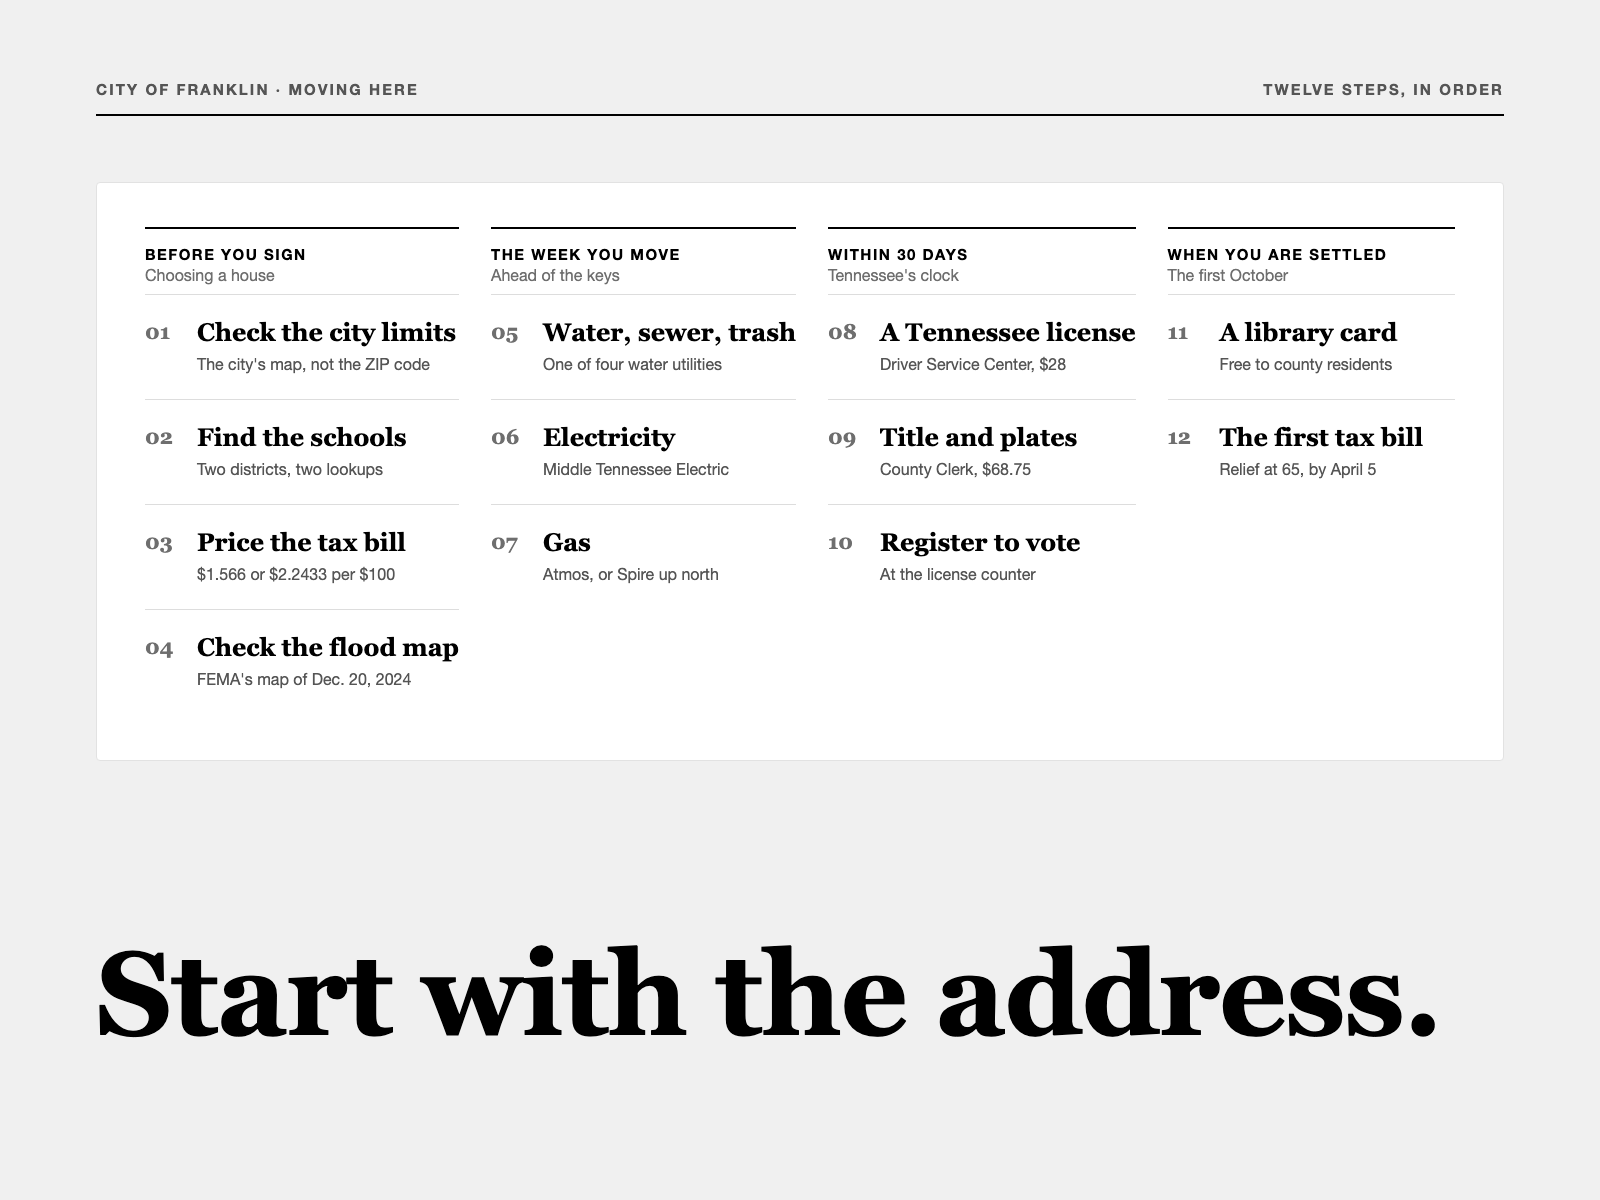
Twelve steps in the order they fall due: what to check before signing, what to start the week you move, and the 30-day clock on a license, plates and a voter registration.
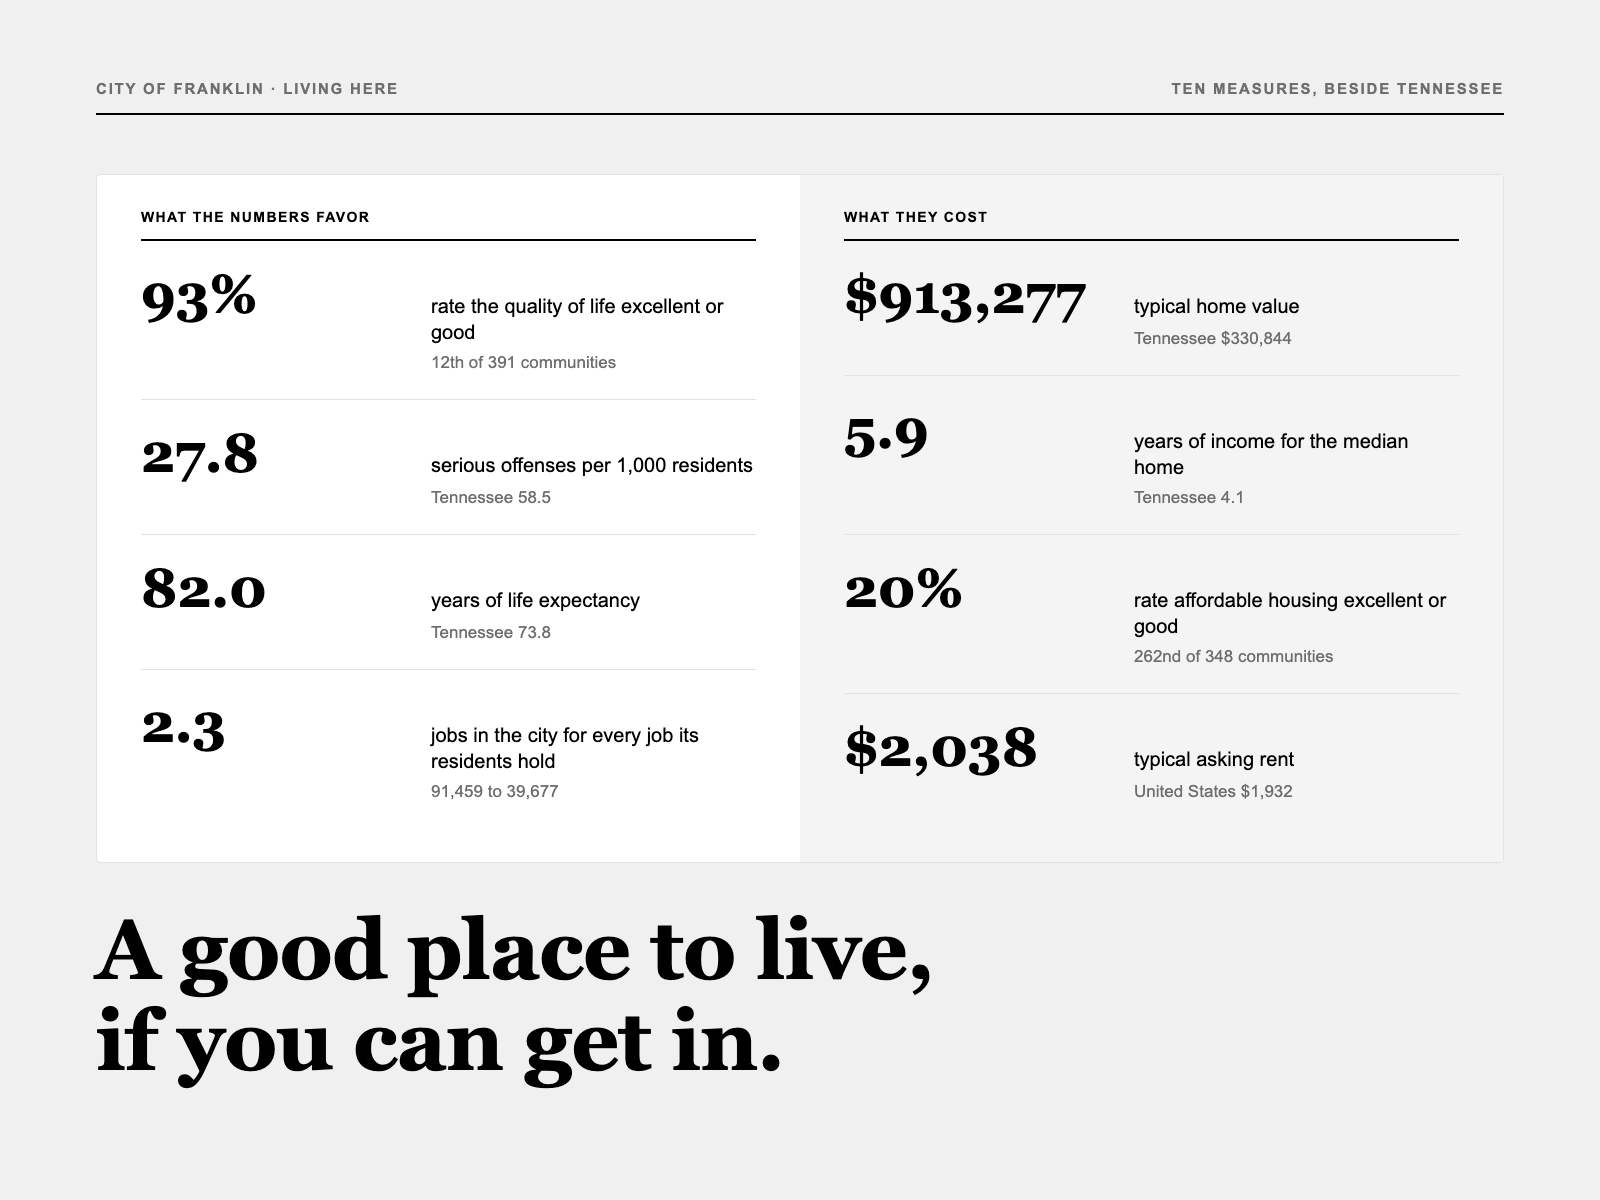
What residents say in the city's own survey, then the figures for cost, schools, crime, health, jobs, commuting, weather and the river, each beside the state's, and which households carry the costs.
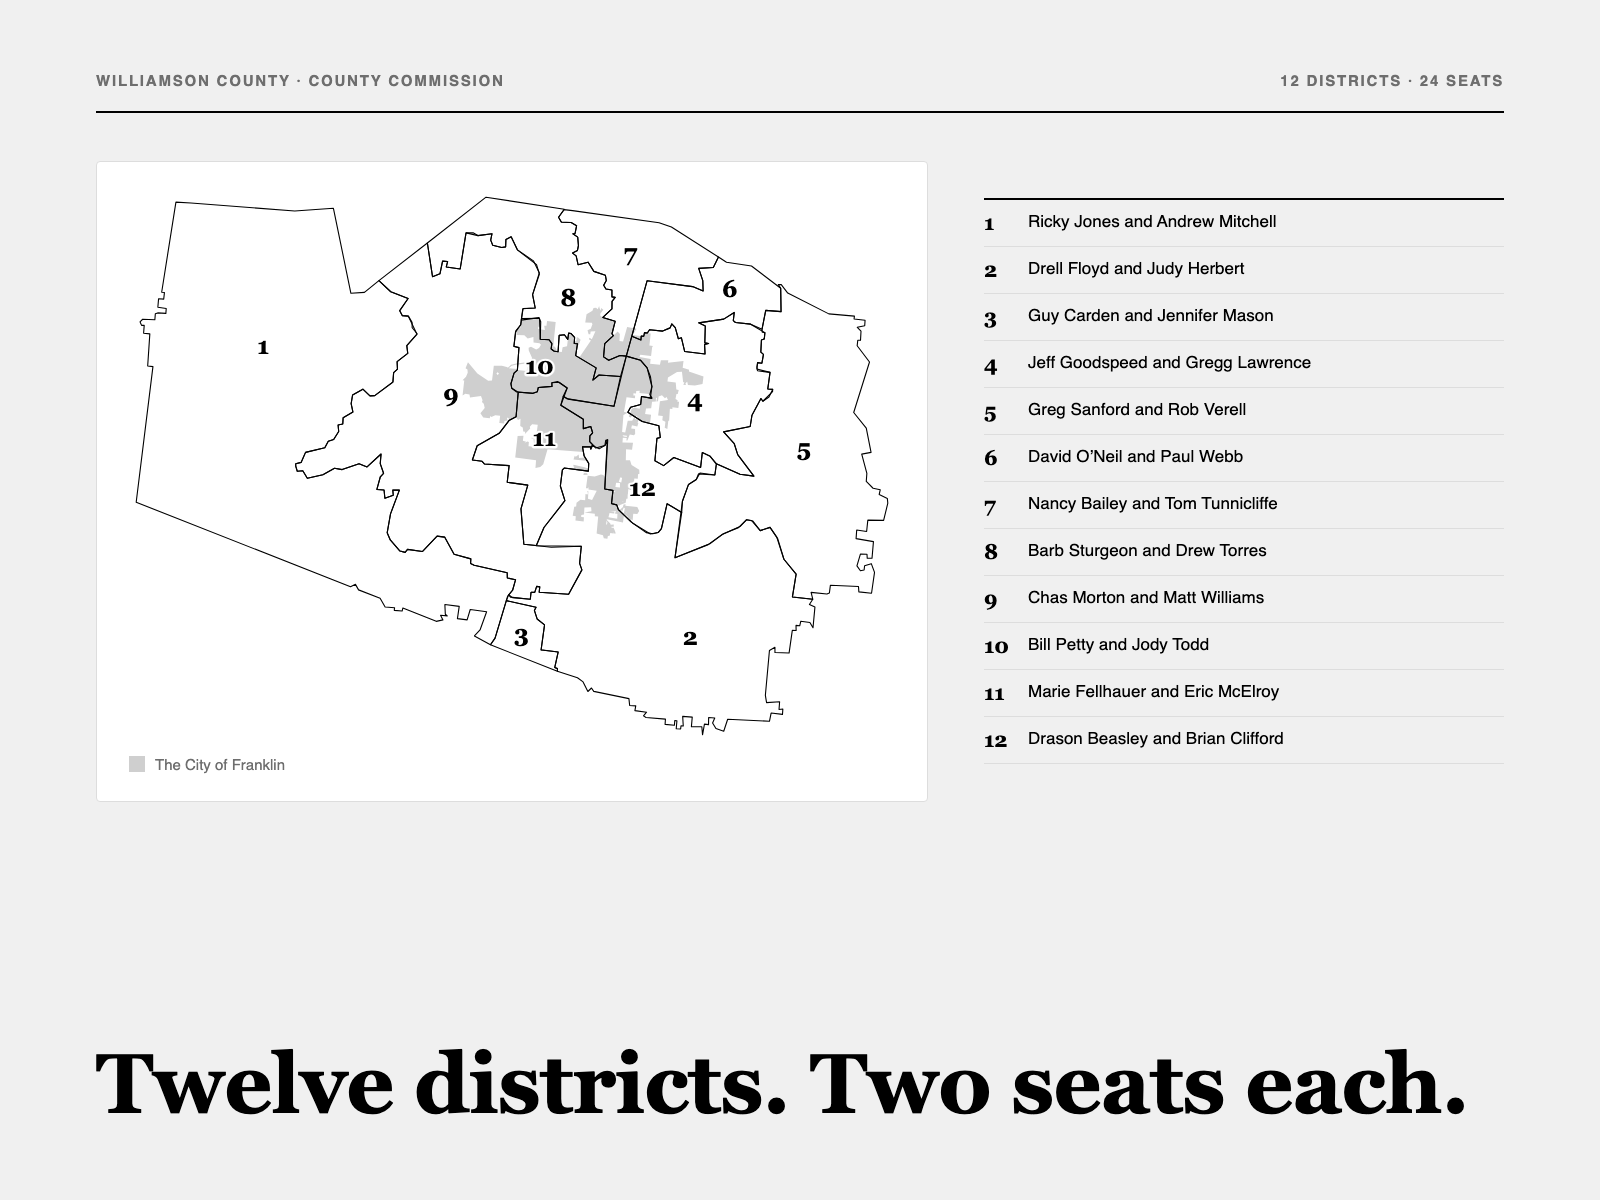
The 24 commissioners and their 12 districts, which two answer to your address, the $921.9 million budget and the tax rate they set in June, how a resolution passes with 13 votes, and how each of them voted in 2026.
The city estimates arrive each spring and rewrite every year back to 2020. When they land, this page is updated the same week and the Monday email says what changed: Franklin's number, its rank, and which of its neighbors grew faster.