1,665
Homes listed for sale in Williamson County in October
City Hall · Housing
Going into winter, buyers in Williamson County have more to choose from than a year ago and are paying more to borrow. Listings are up by almost a fifth, asking prices have barely moved, and the 30-year mortgage rate is a full point higher than last November. Every figure here carries its source and the month it describes, because housing data runs a month or more behind.
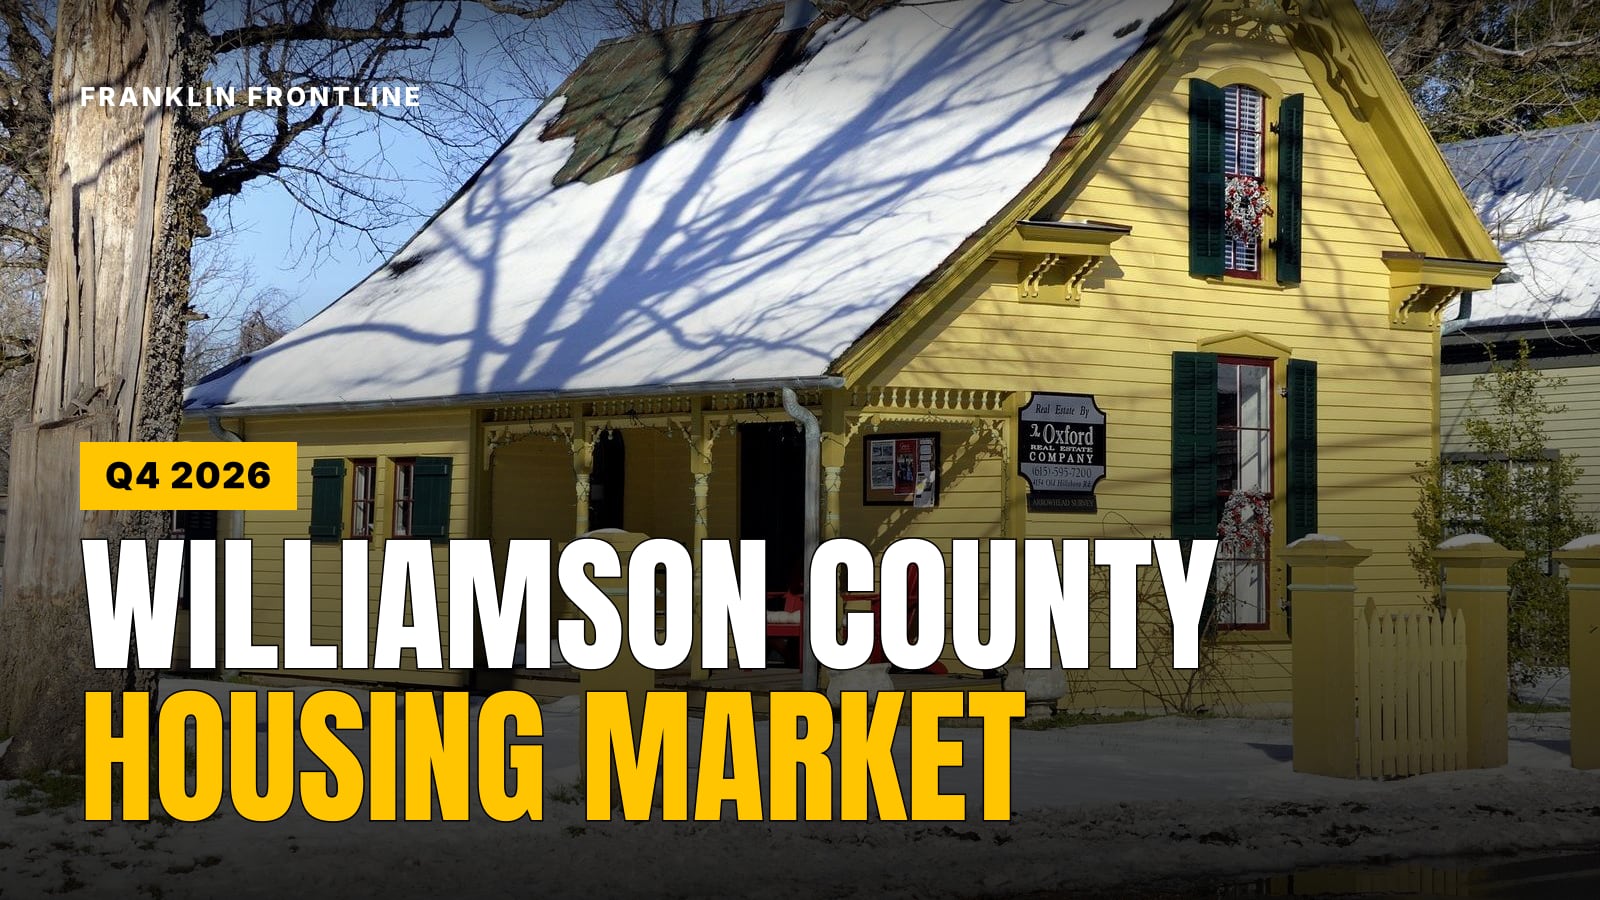
Williamson County had 1,665 homes listed for sale in October 2026, 18.6% more than the 1,404 a year earlier. Asking prices have hardly moved: the median list price was $1,155,000 in September, up 0.9%. The median listing sat 64 days, about where it was a year ago.
The bigger change is the cost of a loan. Freddie Mac's survey put the average 30-year rate at 7.28% in the week of November 19, up from 7.11% the week before and 6.26% a year ago. On a typical Franklin house that adds about $496 a month next to last fall.
Put together, buyers have more to choose from and less to spend. Sellers are mostly holding their prices: 31.6% of listings carried a price cut in September, against 35.0% a year earlier. That share is the number to watch over the winter.
The number of homes for sale in Williamson County follows the seasons. It climbs through spring and summer, then falls back each winter. What has changed is the level. Each fall since 2023 has started from a higher base than the one before.
Compare the same month across years and the climb is plain. October's count has gone up every year, and this October's 1,665 is about 56% more than October 2023's 1,068.
Active listings in October of each year. Source: Realtor.com, via the Federal Reserve Bank of St. Louis.
The high point this year was 1,700 in August, against 1,529 at the 2025 peak in July. Even the winter low has risen: 1,064 homes were for sale in January 2026, up from 906 in January 2025.
| Month | 2023 | 2024 | 2025 | 2026 |
|---|---|---|---|---|
| January | 935 | 897 | 906 | 1,064 |
| February | 881 | 869 | 930 | 1,083 |
| March | 849 | 912 | 1,001 | 1,178 |
| April | 889 | 984 | 1,225 | 1,392 |
| May | 982 | 1,054 | 1,402 | 1,526 |
| June | 1,032 | 1,121 | 1,487 | 1,599 |
| July | 1,098 | 1,160 | 1,529 | 1,679 |
| August | 1,102 | 1,189 | 1,446 | 1,700 |
| September | 1,050 | 1,203 | 1,461 | 1,677 |
| October | 1,068 | 1,212 | 1,404 | 1,665 |
| November | 1,109 | 1,215 | 1,349 | Not yet |
| December | 1,031 | 1,003 | 1,181 | Not yet |
Listings are one measure. Here they are next to Realtor.com's other figures for Williamson County, as published by the Federal Reserve Bank of St. Louis, and Freddie Mac's weekly mortgage survey. Listing data describes homes for sale, not homes sold.
| Measure | Latest | A year earlier | Month |
|---|---|---|---|
| Active listings | 1,665 | 1,404 | October 2026 |
| Median list price | $1,155,000 | up 0.9% since | September 2026 |
| Median days on the market | 64 | about the same | October 2026 |
| Listings with a price cut | 530 | 512 | September 2026 |
| 30-year mortgage rate | 7.28% | 6.26% | Week of November 19 |
| 15-year mortgage rate | 6.66% | Week of November 19 |
Zillow's county figures run a little further behind. It put the typical Williamson County home value at $920,938 at the end of July, up 1.7% on a year, the median sale price at $947,333 in June, and the median time from listing to a pending sale at 26 days.
The two sources measure different things. Realtor.com counts days a listing is active, and Zillow counts days until a buyer goes under contract, which is why one says 64 and the other 26.
Take Zillow's typical Franklin home, $913,277 at the end of September. With 20% down, the loan is about $730,622. The house costs the same either way; the rate decides what it costs to carry.
Principal and interest on a $730,622, 30-year fixed loan, before tax and insurance. Rates: Freddie Mac's weekly survey. Payments: Franklin Frontline's arithmetic.
That is about $496 a month more than at last November's 6.26%, or nearly $6,000 a year. Seen the other way, a buyer who could afford $4,503 a month last fall can now borrow only about $658,176 for the same payment. With 20% down, that buys a house of about $822,700, roughly $90,600 less than the typical Franklin home.
A 15-year loan at 6.66% runs about $6,429 a month on the same balance. That is $1,430 more each month, but the interest over the life of the loan comes to about $426,600, against about $1,069,000 on the 30-year loan at 7.28%.
Owners feel the same rates from the other side. One who sells and buys again gives up the rate they locked in, which our national housing report calls the lock-in effect.
Then come taxes, which depend on where the house sits.
Insurance and any homeowners' association dues come on top. Our property tax explainer shows how to work out the bill for a particular address and which zone it sits in.
No single number settles it, so here are the five we track and which way each one points. On balance, the county is leaning toward buyers, though sellers are not cutting prices as often as they were a year ago.
Our read of the five signals below, not a measured index.
| Signal | Latest reading | Points toward |
|---|---|---|
| Homes for sale | 1,665 in October, up 18.6% on a year | Buyers |
| Mortgage rate | 7.28%, a point above a year ago | Buyers, since fewer can afford to bid |
| Median list price | $1,155,000 in September, up 0.9% | Neither |
| Days on the market | 64 in October, flat on a year | Neither |
| Share of listings with a price cut | 31.6% in September (530 of 1,677), down from 35.0% (512 of 1,461) | Sellers |
The price-cut share is our arithmetic from Realtor.com's counts. If it starts rising over the winter while listings stay high, the balance tips further toward buyers.
Zillow's typical home value smooths out the mix of houses that happen to sell in a month, so it is the fairer figure for comparing towns. Median sale prices swing more, especially in small towns with few sales.
Zillow's typical home value, latest month published for each place. Fairview and Spring Hill are left off because we did not read a Zillow figure for them.
| Town | Typical home value | Recent median sale |
|---|---|---|
| Brentwood | $1,388,985, up 4.1% (Zillow, September) | $1,452,917 (Zillow, August) |
| Franklin | $913,277, up 3.0% (Zillow, September) | $940,303 (Zillow, August) |
| Nolensville | $843,614, up 3.3% (Zillow, August) | $929,385, down 7.1%, 74 sales (Redfin, August) |
| Thompson's Station | $729,865 (Zillow, October) | $730,000 (Zillow, September) |
| Fairview | $549,701, down 2.2% (Redfin, June) | |
| Spring Hill | $508,284, down 4.1% (Redfin, August) |
Most of Spring Hill is in Maury County, so its figures describe both sides of the county line. Redfin put Thompson's Station's September median at $833,246, well above Zillow's, which shows how far a small town's monthly number can move with a handful of sales.
Buying. You have more homes to look at than at any October in the last four years, and the median listing sits about two months. Price the loan before the house: each tenth of a point on the rate moves the payment on a $730,622 loan by roughly $50 a month. Ask which tax zone a house is in, because the Franklin Special School District adds about $1,547 a year on a typical Franklin home.
Selling. You are competing with more listings than a year ago, and your buyers are paying more to borrow. List prices have held so far, and fewer sellers have cut than last fall. Winter usually thins the field: in each of the last three years, listings fell from November to December, from 1,109 to 1,031 in 2023, 1,215 to 1,003 in 2024 and 1,349 to 1,181 in 2025.
This page reports public data and is not financial advice. A lender can quote your own rate, and a local agent can price a particular house.
Monthly counts of closed sales for the county come from the regional listing service, and brokerages publish them. We could not check those figures against a public source, so they are not in this report. The Greater Nashville Realtors publish county figures only quarterly.
Realtor.com's November numbers are due on December 10. We will update this page then, and publish the full fourth quarter in January. Three things to watch until then:
For the long view, our 2026 housing report covers the national market; it is sponsored by Iron Hill Capital. For what is being built, see the Development Report for the third quarter.
Read November 20, 2026. Each figure carries the month it describes. Percentage changes, the price-cut share and the payment figures are our arithmetic from the published values.
How we reportCorrectionsSend a correction
Next

Most Franklin restaurants have not posted their 2026 holiday hours yet. Here is who has, who closes, and where to order Christmas dinner to go, with the dates you need to know. We add each place as it posts.
Two loops from the downtown transit center every half hour, a $1 fare, a ride you book a day ahead for the rest of town, and a free shuttle downtown on three holiday Saturdays.

City staff put three concepts for the stretch from Mack Hatcher Parkway to Mallory Station Road in front of the board on October 27. The smallest adds one lane; the largest makes it five. The board asked for more information and set no vote.
Stock photo: fr0ggy5 on UnsplashThe List brings you each quarter's housing and development numbers the week they land, with the sources linked. It goes out Monday and Thursday.
Free · Monday and Thursday · Read an issue first